Market Overview: FTSE 100 Futures
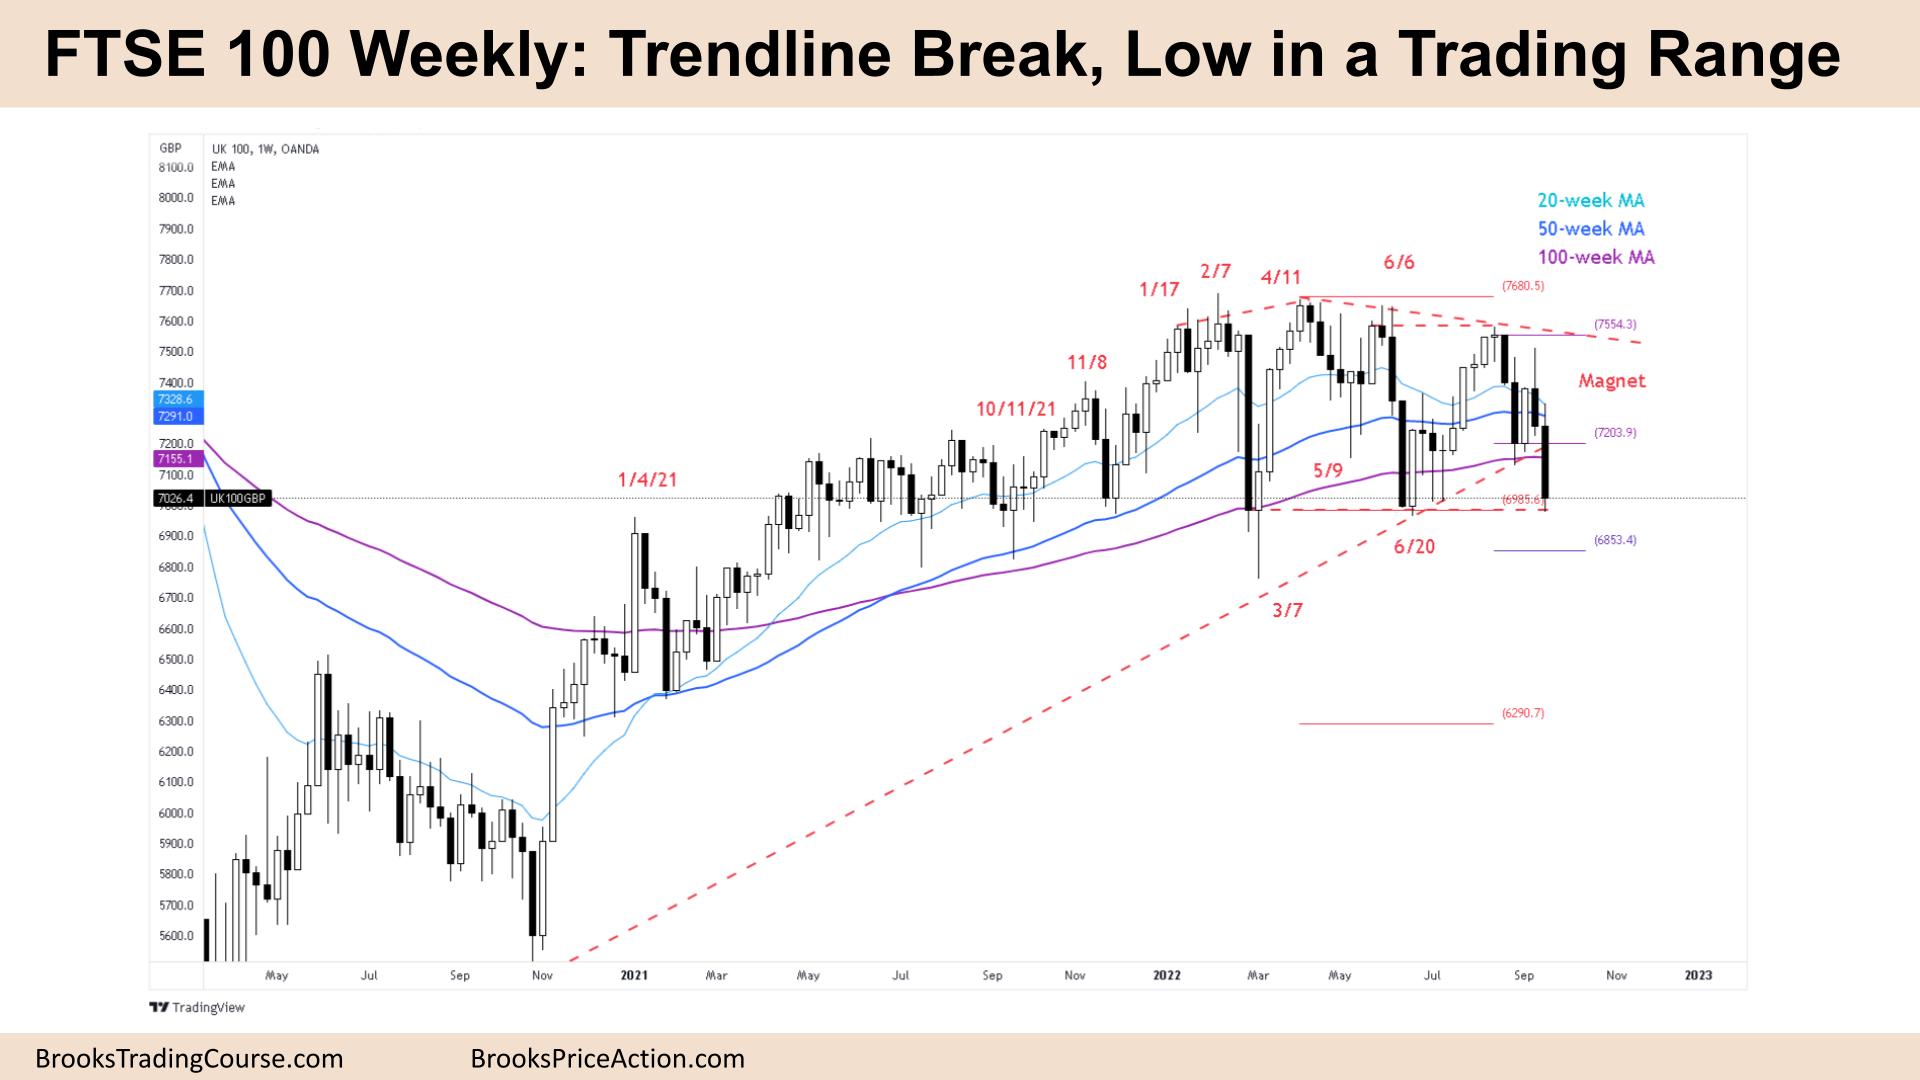
The FTSE futures market moved down strongly with a bear bar closing near its low on the weekly chart. It is a long-term FTSE 100 trendline break and could signal a larger move down in the medium term. Bulls have been buying here for over 12 months and making money so limit bulls will likely step in again. A reversal next week could setup a higher low major trend reversal back into the range. Bears want a break or breakout test for a measured move down. Even if they get another leg, it could setup a wedge bottom buy signal for the bulls which could be a great long-term swing trade.
FTSE 100 Futures
The Weekly FTSE chart

- The FTSE 100 futures was a bear bar closing near its low so we might gap down on Monday.
- It is also the second consecutive bear bar closing near its low so we might get another leg down.
- For the bulls, they expected 2 legs sideways to down after a 5-bar tight bull micro channel. But it was a lower high with June so traders sold strongly high in the range where the math was good.
- The bulls also see a breakout test of the trading range below and a tight trading range for many months so it is a magnet.
- The bears see we are always in short again low in the trading range at support and breaking below the 100-week moving average.
- It has been over 50 weeks since the bears were able to get a gap bar below this moving average so it is a reasonable long-term buy signal.
- The bears want a break below here with a close below June and then March to signal the move. But we didn’t break below June so it might not be as bearish as it seems yet.
- The bulls want a reversal bar like in March – trading below Mon/Tue and then finishing the week on its high for a reasonable buy setup. However, after 22 strong bear bars, it might be better to wait for a second buy signal which has a higher probability.
- If you trade always in, better to be flat or short. Stop-entry bulls need a buy signal but limit-order bulls can buy below the bar betting 80% of breakouts fail. Targets below.
- Because it is a nearly 2-year trendline break we can expect to test the breakout point and maybe even the extreme or the lower high before making the move down.
- Luckily for the bulls, the bears’ stop is far away and they might not want to risk that much just yet. Even if they get a 3rd leg it could form a wedge bottom, low in a trading range which is a high-probability buy setup.
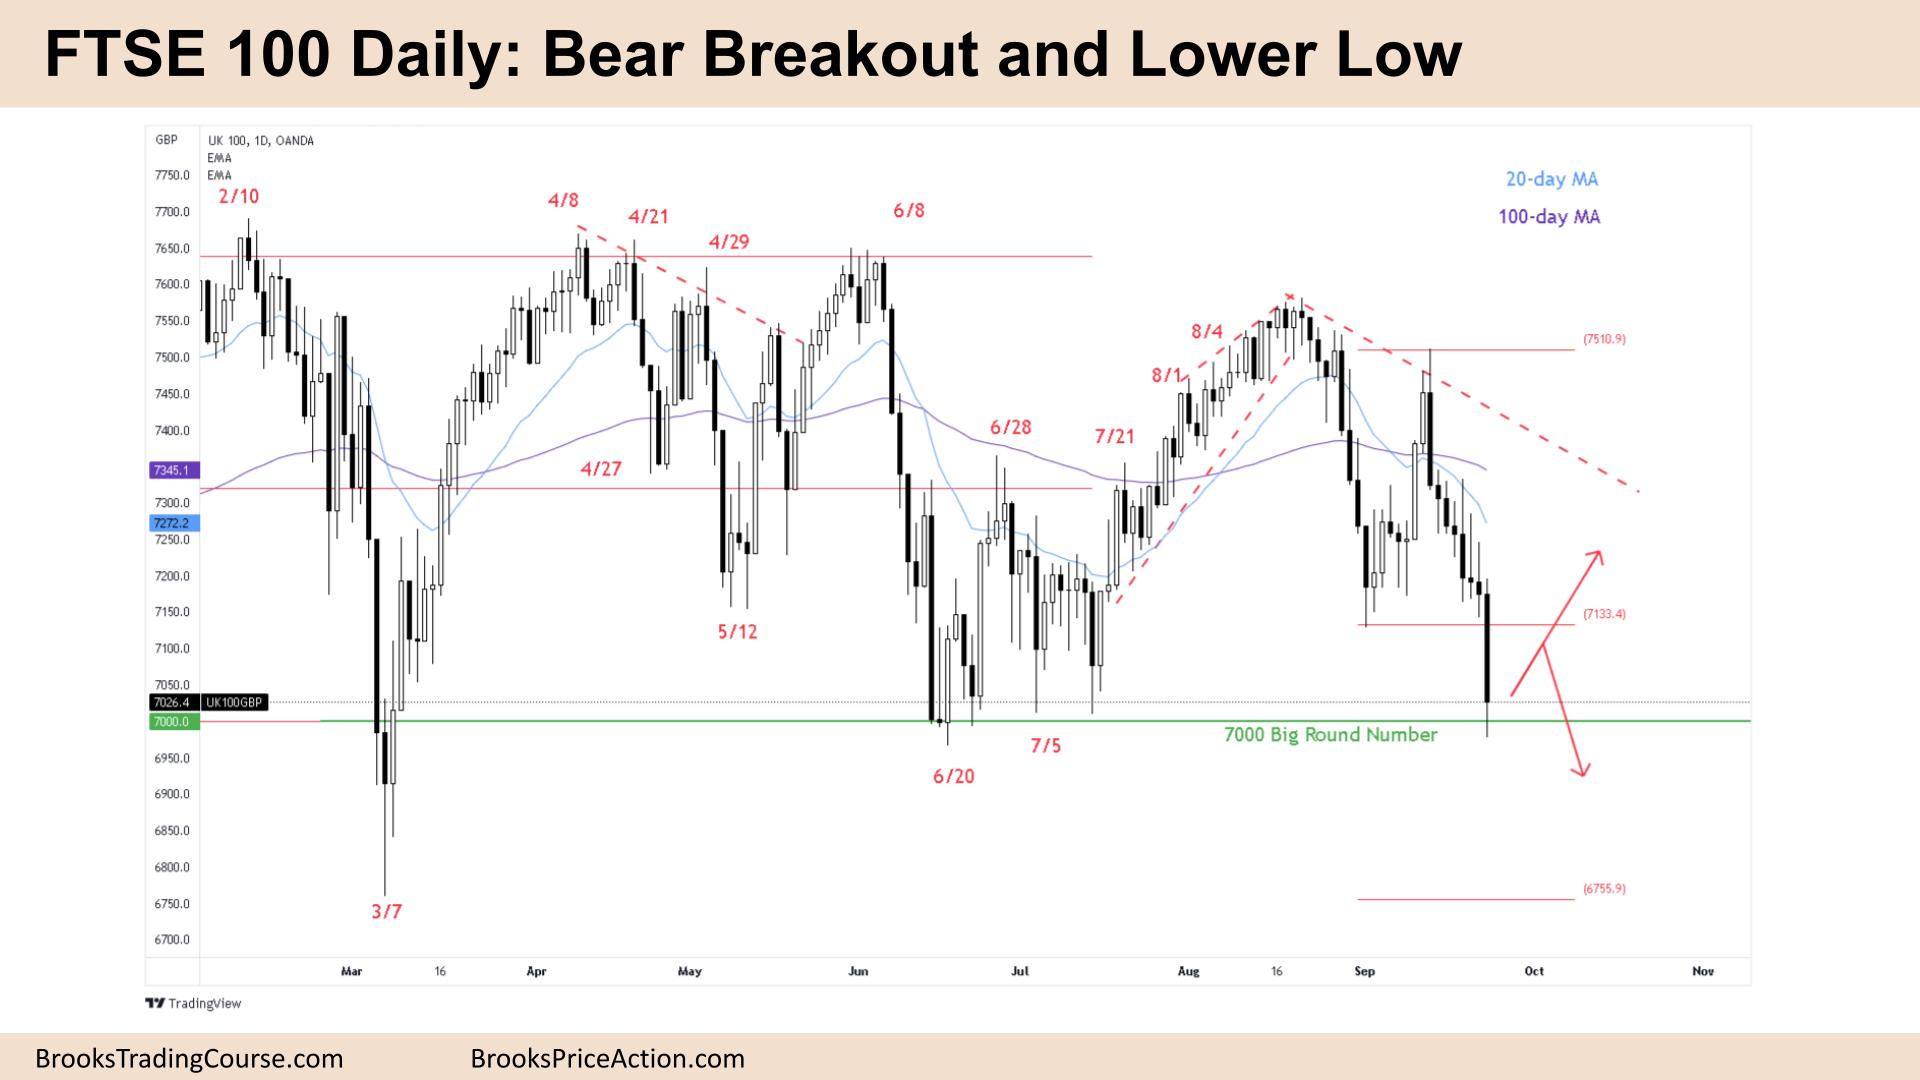
The Daily FTSE chart

- The FTSE 100 futures was a bear bar closing near its low on Friday so we might gap down on Monday.
- It is the 8th consecutive bear bar so it is a tight bear channel and most traders should not buy. It is the 5th consecutive bear bar without a bar going above its high, so the first reversal will likely be minor.
- The bulls see a sell climax and possible double bottom with July. They see a possible higher low, major trend reversal and will look to buy a High 1 or second-entry High 2 low in the trading range for a move back up. They know that 80% of breakouts fail.
- The bears see a tight bear channel and a breakout, so will look for a measured move at first from the lower high, which is around the March lows. But we will not necessarily go straight down.
- The bears want a follow-through bar but the risk is big so they might wait to sell above a pullback bar and a Low 1 signal or Low 2.
- The bulls know we are far below the moving average and might have moved too quickly so they can take a reasonable scalp back up to the moving average with a good buy signal. Most traders should wait for more information.
- Its a trading range for many months so no matter how bearish it looks at the bottom it could be a sell vacuum test of the lows and favors buying down here.
- Its a higher time frame trendline break so we might need to retrace briefly before continuing down for another leg.
Market analysis reports archive
You can access all weekend reports on the Market Analysis page.