Eight consecutive bull bars on Emini weekly chart so climax
I will update again at the end of the day.
Pre-Open market analysis
Yesterday rallied strongly and broke above last week’s high. The Emini is now testing the 200 day moving average, which has been resistance for several months.
The bulls want the rally to break above the October-December triple top. While it might, there will probably be at least a 2 – 3 week pullback 1st.
This is now the 8th consecutive week with a bull body on the weekly chart. This is the 1st it has happened in 6 years. Since it is extremely rare, the odds are that this week or next week will have a bear body. A reversal down from here would form an expanding triangle top on the 60 minute chart.
After an 8 bar bull micro channel, the bulls will be eager to buy the 1st 1 – 3 week pullback. Consequently, the downside risk is small in February.
Overnight Emini Globex trading
The Emini is up 6 points in the Globex session. It is at the resistance of the 200 day EMA. In addition, this is the 3rd bull bar in 5 weeks on the weekly chart. Therefore, this rally is a small parabolic wedge buy climax at resistance. The odds favor at least a 1 – 3 week pullback beginning within a week. Consequently, there is an increased chance of bear trend days for a couple weeks.
Yesterday ended with a trading range in a bull trend on the 5 minute chart. Since there is a possible wedge top and expanding triangle top on the 60 minute chart, yesterday’s trading range might be the final bull flag. As a result, traders will look for a reversal down today.
Can today be another big bull trend day? Not likely. There is a parabolic wedge buy climax and an unsustainable streak of 8 bull bars on the weekly chart. Also, it is at the resistance of the 200 day moving average. Finally, the 60 minute chart might form a top today or tomorrow. These factors reduce the chance of a big bull day today.
Yesterday’s setups

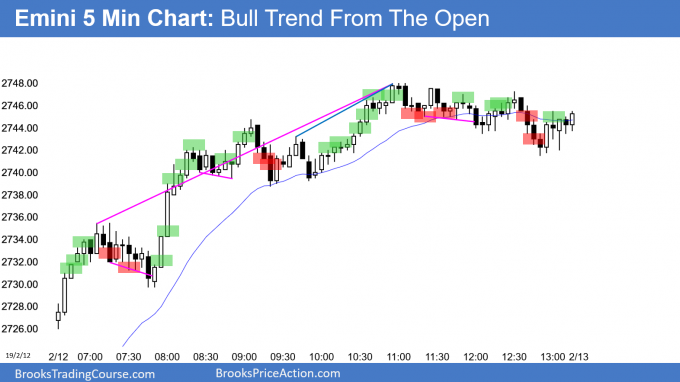
Here are several reasonable stop entry setups from yesterday. I show each buy entry with a green rectangle and each sell entry with a red rectangle. I rarely also show limit order entries and entries on the close of bars. My goal with these charts is to present an Always In perspective. If a trader was trying to be Always In or nearly Always In a position all day, and he was not currently in the market, these entries would be logical times for him to enter.
EURUSD Forex market trading strategies

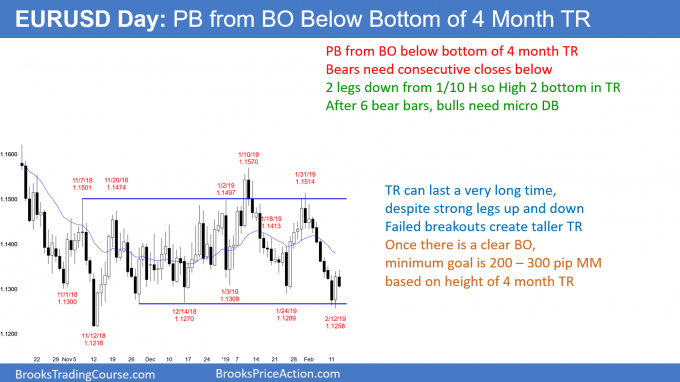
After Friday broke below the December low, yesterday was a big outside up day. Since there was an 8 day bear micro channel, bears were eager to sell. As expected, they sold above Friday’s high. Today so far is a bear day. If today closes below its midpoint, it would be a credible sell signal bar for tomorrow. Today would be a Low 1 bear flag and a pullback from Friday’s bear breakout.
Because yesterday was a big outside up day, there are still strong bulls at the bottom of the range. Consequently, they will probably buy again around the December low. The result would be a micro double bottom.
However, the bears will probably sell again around Friday’s high and the 20 day EMA. That would create a Low 2 bear flag at the EMA. Strong bulls and bears usually lead to a small trading range.
Probably forming small trading range
That is what is likely over the next few days. The bulls will have a micro double bottom and the bears will have a micro double top. This would be a Breakout Mode pattern.
The momentum down favors the bears and the support at the bottom of the range favors the bulls. If one side had a significant advantage, the breakout would be clear. It is not, and therefore traders will take quick profits over the next few days until there is either a strong bear breakout or bull reversal.
Overnight EURUSD Forex trading
Yesterday was an outside up day after a sell climax. It is therefore a buy signal bar. But, the EURUSD 5 minute chart sold off 50 pips overnight from the breakout above yesterday’s high.
This is disappointing for the bulls, just as the big outside up day yesterday disappointed the bears. Disappointment is a hallmark of a trading range, which is probably beginning to form.
While it is possible that today will go below yesterday’s low and form a 2nd consecutive outside day, that is unlikely. If it did, today would be a good sell signal bar for tomorrow. Consecutive outside days form a reliable pattern.
More likely, there will be buyers around the current price, which is slightly more than a 50% pullback from the rally up from yesterday’s low. Alternating big moves up and down is a sign of confusion, which typically leads to a trading range. That is what is likely today.
Summary of today’s S&P Emini futures price action and what to expect tomorrow

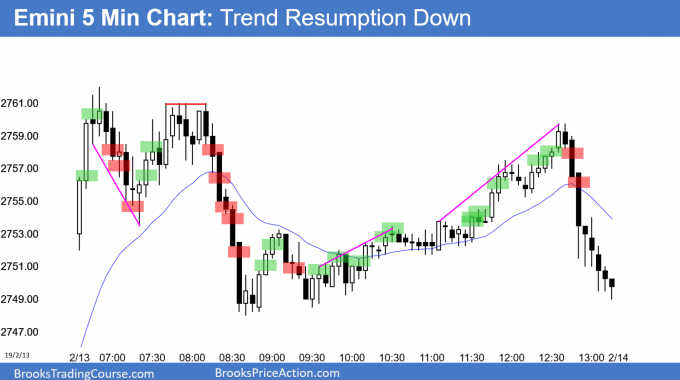
Here are several reasonable stop entry setups for today. I show each buy entry with a green rectangle and each sell entry with a red rectangle. I rarely also show limit order entries and entries on the close of bars. My goal with these charts is to present an Always In perspective. If a trader was trying to be Always In or nearly Always In a position all day, and he was not currently in the market, these entries would be logical times for him to enter.
End of day summary
After gapping up, the Emini sold off in a Bear Trending Trading Range Day. After a midday rally, it sold off and closed near the low. Today is therefore a sell signal bar for tomorrow. This is taking place at the 200 day moving after and after a wedge rally on the daily chart. The odds favor a 2 – 3 week selloff starting within a week. Today might be the start.
See the weekly update for a discussion of the price action on the weekly chart and for what to expect going into next week.
Trading Room
Traders can see the end of the day bar-by-bar price action report by signing up for free at BrooksPriceAction.com. I talk about the detailed S&P Emini futures price action real-time throughout the day in the BrooksPriceAction.com trading room. We offer a 2 day free trial.
Charts use Pacific Standard Time
When I mention time, it is USA Pacific Standard Time (the Emini day session opens at 6:30 am PST, and closes at 1:15 pm PST). You can read background information on the intraday market reports on the Intraday Market Update page.
Al, would you be able to start writing a short “What to expect tomorrow” section on EURUSD? This would be super-helpful to your students who live in Europe & Asia – as our day is half-gone by the time we read your blog every day.
I realise you already do a lot, but arguably the E-mini “what to expect” is less important than an EURUSD one because your full daily update always arrives before the E-mini session starts; unlike the EURUSD session which is half over by the time your blog arrives so I think your Forex students would get more value out of this than the E-mini students.
I spend my mornings on EURUSD so confused until I read it, but I just got long on a double bottom after reading today’s post, and had a similar experience yesterday. It is really helpful.
By the way is this a possible MTR? https://1drv.ms/f/s!Ajlj7dTld4OYgf86_ol2iSzo59lxqA
That is the 60 minute chart of the EURUSD. While it could become a major trend reversal, the selloff is abrupt. The bulls typically have to stop the selling for several bars before they can begin a bull trend. Therefore, there is not a good buy setup yet, but there might be after several more hours. The bulls will probably need at least a micro double bottom. Even then, the 2 week selloff was extremely strong. When that is the case, the bulls typically need 10 or more sideways bars before they can create a bull trend. The best the bulls can probably get is a trading range over the next few days.