Trading Update: Monday November 15, 2021
Emini pre-open market analysis
Emini daily chart
- Strong reversal up on Friday after 5 consecutive bear bars. Emini is testing the 4700 Big Round Number.
- The November 5th top came from just below the top of the 15-month bull channel. Some traders believe that the resistance was not adequately tested. They want to see a reversal down from above the top of the channel. Since the channel is rising, the top is now around 4740. It is a magnet above.
- I wrote last week that while the selloff was strong, every strong selloff since the pandemic crash was a bull flag and led to a new high.
- What is different this time is that the November 5 high was a reversal down from the top of a month-long parabolic wedge and the top of a 6-month bull channel. That increases the chance of at least a small 2nd leg sideways to down before the rally gets much above the high or above the top of the 15-month bull channel.
- But even if there is a double top reversal, traders will still buy it.
- This has been an extremely strong bull trend and at no point did the bears ever have more than a 50% chance of a trend reversal.
- They will need an extremely strong selloff, probably to below the bottom of the bull channel, before many traders will think that a correction is likely. Until then, they will buy every reversal down.
Emini 5-minute chart and what to expect today
- Emini is up 15 points in the overnight Globex session.
- It will gap up. The bulls want a strong breakout above the 4700 Big Round Number and then a new all-time high.
- However, Friday had a very strong rally, but then entered a trading range for several hours. That is an area of agreement and therefore a magnet. If there is a reversal down in the 1st couple hours, it will probably continue down to the middle of Friday’s range.
- The Emini went sideways for several days last week around 4700. Also, the selloff had 5 consecutive bear days, which is relentless selling. Both of these facts increase the chance that yesterday’s rally will stall again here for at least a couple days.
- While a trading range around 4700 is likely for a few days, any day can be a trend day. If there is a series of strong trend bars in the 1st hour, traders will expect a trend day.
- If there is a trend, up is more likely after Friday’s strong rally.
EURUSD Forex market trading strategies
EURUSD Forex daily chart

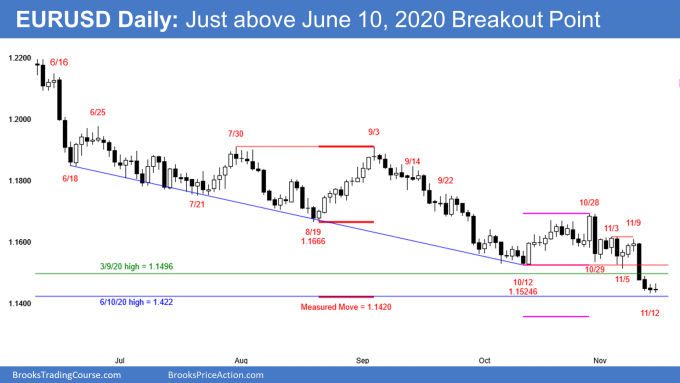
- I have been writing regularly for a couple months that the EURUSD would probably have to fall below the March 9, 2020 high.
- That is because it has been in a trading range for 7 years and when in a trading range, a leg up usually begins after falling below support.
- That high was the breakout point of last year’s strong rally. It is therefore important support and a strong magnet. The EURUSD broke below it last week.
- I also said that the selloff might continue down to below the June 10, 2020 high, which is a less important breakout point.
- Since the EURUSD has already done the minimum, there is now an increased chance of a reversal up at any time.
- Last week’s big bear day was a strong enough Surprise Bar for traders to expect at least a small 2nd leg down.
- The EURUSD will probably fall below the June 10, 2020 high because the momentum down is strong and that price is almost exactly a measured move down from the October trading range.
- There is only a 30% chance that this year’s bear trend will continue all of the way to the bottom of last year’s rally or below the bottom of the 7-year range.
- However, if the bears continue to form bear bars on the weekly and month charts, that probability will go higher.
- While the selloff should go a little lower, there is better than a 50% chance that there will be a 1- to 2-month rally from around where the EURUSD currently is or from around the June 26, 2020 low, which was the 1st pullback from last year’s breakout of the triangle bottom.
- With important magnets just above 1.14 and the momentum down strong, the odds favor at least slightly lower prices over the next couple weeks.
- Since major currency reversals have an increased chance of beginning at the start of a year, the selloff might continue through December.
Summary of today’s S&P Emini futures price action and what to expect tomorrow

End of day summary
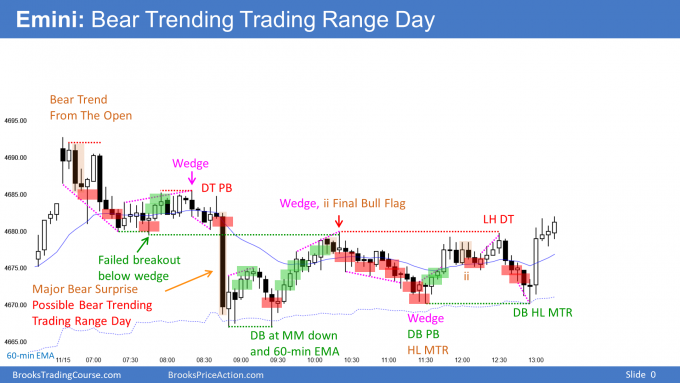
- The Emini had a small gap up, but it closed in the first hour, which is typical with small gaps.
- After trading in a tight trading range for a couple hours, there was a Major Bear Surprise Bar.
- Since its low was at the 60-minute EMA and one tick below yesterday’s trading range low, it was a good candidate for a 2nd Leg Bear Trap. And that is what it turned out to be. Bears bought back shorts and bulls bought, betting on a bounce.
- The Emini then entered a lower trading range and formed a Bear Trending Trading Range Day.
- The bears see today as a lower high sell signal bar for tomorrow. There is now a lower high double top on the daily chart with the November 5 all-time high.
- However, the Emini is more likely to continue the 8-day tight trading range for at least another day. The bulls will probably try again to get above 4700 and the November 5 all-time high before they would consider giving up.
See the weekly update for a discussion of the price action on the weekly chart and for what to expect going into next week.
Trading Room
Traders can see the end of the day bar-by-bar price action report by signing up for free at BrooksPriceAction.com. I talk about the detailed S&P Emini futures price action real-time throughout the day in the BrooksPriceAction.com trading room. We offer a 2 day free trial.
Charts use Pacific Time
When I mention time, it is USA Pacific Time. The Emini day session charts begin at 6:30 am PT and end at 1:15 pm PT which is 15 minutes after the NYSE closes. You can read background information on the market reports on the Market Update page.
Hi Al,
You’ve marked bar 8 as a good short, but other times in similar situations when the entry is close to the moving average you say: “but just above (or bellow) the moving average” and you don’t mark it as a good trade. I don’t understand when is a good trade and when is “just above the moving average”. Thank you.
In general, you are right. Here, it was the 2nd time with consecutive bear bars where one was big and it closed near its low. An IB with a close on its low often leads to a swing. Here, it did as well, but a trader would have had to hold for 20 bars first.
Hi Dr. Brooks, could you help me with understanding some of the price action today? I cannot figure it out.
For example, the short below bar 46. I saw the wedge channel leading up to that setup, but isn’t the wedge bull channel from 35-46 fairly tight? How do we not know that there wouldn’t be buyers below because of how tight the bull channel is?
I had the same fear with the lower high at Bar 49. How do we not know that the tightness of the bull channel wouldn’t create a H2 after we enter short below Bar 49? I did take the short below Bar 53 because I was more confident in going short after a H2 failure.
I also had the same problem when it came to Bars 60, 61, 62 because I saw the bear channel from Bar 46-60 as tight and I was afraid of immediate sellers above after entering on 60, 61, 62 so I did not buy.
Obviously my fear was unjustified because these trades succeeded. Fear comes from a lack of confidence, and a lack of confidence comes from a lack of skill, and I want to get better.
The fundamental issue was that the market was likely forming a trending trading range day. Traders look to sell rallies and buy selloffs. Nothing looks right on a trading range day and that is one of the things that makes you conclude it is a trading range.
The easiest thing is to use wait for the few clearest setups, like buying above 37 or 61, or selling below the 46 failed breakout above the ii at the top of the lower range.
More experienced traders can use wide stops and scale in, but most traders starting out will mess that up. For example, if a beginner bought below 15, he would probably exit on the clos of 27. A pro might add to his longs.
Thank you Dr. Brooks.