Trading Update: Monday January 24, 2022
Emini pre-open market analysis
Emini daily chart
- The Emini broke below the December 2021 lows and the 200-day moving average last week.
- Al has been saying the Emini has likely been in a trading range since July 2021 on the daily chart. So the odds have favored a test of the December as well as the October 2021 lows.
- The bears were able to get a successful wedge reversal with the December 28 high, so the odds favor two legs down from the wedge top (September 2, November 22, December 28).
- The bulls are hopeful that this is a sell vacuum to the 200-day moving average and a 2nd leg trap following the four consecutive bear bars last week. More likely, this 7-bar bear microchannel ending on January 21 is strong enough for at least a second leg down.
- So far, the market has four consecutive bear closes. The last time the daily chart had five or more closes was in February 2020. This increases the odds that today will be a bull close.
- The stop is far away from the bears, which increases the odds of profit-taking soon and a rally that will likely develop into a bear flag.
- Even if the market has a deep pullback to the upside, the bulls will likely need at least a micro double bottom before having a reasonable buy step for a swing trade.
- It is a trading range on the daily chart, so even if the market falls to the October 2021 lows, bulls will see this as support and be happy to buy, betting this is just a bull flag on the higher time frames.
Emini 5-minute chart and what to expect today
- The market is currently 60+ points below Friday’s close.
- The bears are hopeful the market gets another bear close, which would show further strength by the bears and increase the odds of price getting down to the October 2021 lows.
- The odds favor a trading range open. The market has fallen significantly over the past four trading days, and the bears will likely want to sell a pullback on the higher time frames, which is why I think today will be disappointing for the bears, and the day is likely to not close on its low.
- Most traders will look for some strong breakout on the open in the form of a double bottom or double top or a wedge bottom or wedge top before committing to swing trade.
- Traders should expect a trading range open today and be ready for a possible trading range day.
Yesterday’s Emini setups

Al created the SP500 Emini charts.
Here are several reasonable stop entry setups from yesterday. I show each buy entry with a green rectangle and each sell entry with a red rectangle. Buyers of both the Brooks Trading Course and Encyclopedia of Chart Patterns have access to a much more detailed explanation of the swing trades for each day (see Online Course/BTC Daily Setups).
My goal with these charts is to present an Always In perspective. If a trader was trying to be Always In or nearly Always In a position all day, and he was not currently in the market, these entries would be logical times for him to enter. These therefore are swing entries.
It is important to understand that most swing setups do not lead to swing trades. As soon as traders are disappointed, many exit. Those who exit prefer to get out with a small profit (scalp), but often have to exit with a small loss.
If the risk is too big for your account, you should wait for trades with less risk or trade an alternative market like the Micro Emini.
EURUSD Forex market trading strategies
EURUSD Forex daily chart

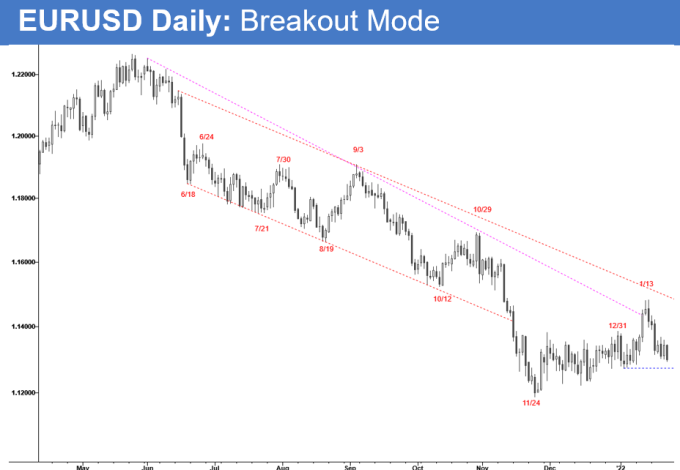
- The EURUSD failed to stay above the breakout point of the two-month trading range and is currently back in the middle of the tight trading range.
- The bulls hope the market stays above the January lows and forms a higher low major trend reversal that breaks above the January 14 high and races up to the November 2021 highs and eventually to the September 2021 highs.
- The bears are hoping the 3-bar breakout ending on January 18 is strong enough to break below the November 2021 lows, creating a bear flag from November 2021 to the January highs. If they get the bear breakout below the November lows, they will hope for a measured move down of the two-month trading range.
- Both the bulls and bears expect a measured move up or down based on the tight trading range. The market is clearly in breakout mode, meaning the probability for both the bulls and the bears must be close to 50%. If one side had a high probability the market would be trending strongly and not appear confusing.
- Even if the market test is lower and falls below the November lows, the odds are this will be a final flag, and traders will look for major trend reversal and reversal back up.
Summary of today’s S&P Emini futures price action and what to expect tomorrow

End of day summary
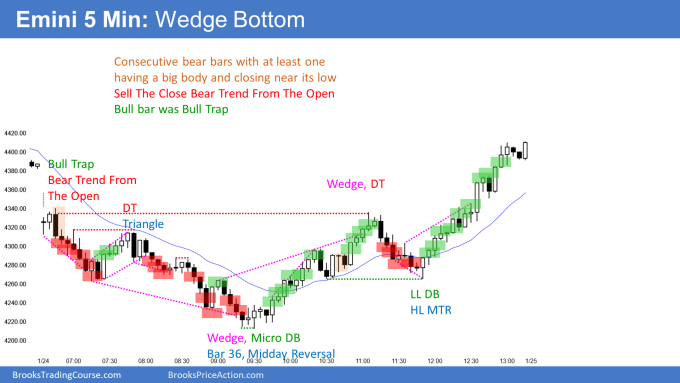
- The Emini gapped down and formed a bear trend from the open.
- The selloff tested the October 2021 low (4260.75) at 7:15 but failed to test it adequately. This increased the odds that any rally would be followed by a test of the October low.
- The market formed a triangle at 8:00, which ended up being a final flag that led to two bear breakout attempts below the October low before reversing up. The breakout down to 9:30 formed a wedge bottom and a reasonable buy setting for a possible low of the day.
- The market rallied back to the open of the day and pulled back by 11:50, creating a reasonable buy for a double bottom higher low major trend reversal.
- It is possible tomorrow may gap up since today is a reasonable buy. The bulls will want a strong entry bar, and the bears will want to damage the bull case as much as possible.
See the weekly update for a discussion of the price action on the weekly chart and for what to expect going into next week.
Trading Room
Traders can see the end of the day bar-by-bar price action report by signing up for free at BrooksPriceAction.com. I talk about the detailed S&P Emini futures price action real-time throughout the day in the BrooksPriceAction.com trading room. We offer a 2 day free trial.
Charts use Pacific Time
When I mention time, it is USA Pacific Time. The Emini day session charts begin at 6:30 am PT and end at 1:15 pm PT which is 15 minutes after the NYSE closes. You can read background information on the market reports on the Market Update page.
With so many bear bars breaking below Oct lows and reversing.. should most wait for a second entry long.
I think most traders are expecting a trading range more than a strong swing up. Your question really comes down to personal preference.
In general, since the daily chart is in a trading range, you know the odds cannot be less than 40% that buying above which means on has at least a 40% of making 2 times their risk. Other traders will look at the reversal bar yesterday and buy a 50% pullback of the bar, this improves their risk/reward on the trade, but also lowers their probability.
While it is a 8 bar bear micro channel, traders may wait for some kind of micro double bottom. It really comes down to trade preference and overall trade management. I do think most traders buying above yesterday’s bull bar will probably be willing to buy more below the bar as well.
Thanks for the detailed report! So Monday daily bar is a H1 buy signal bar given that Tue’ will go above?
You can call it a high 1, but I think a lot of traders will call it a double bottom with the October lows as well. Either one is correct.