Emini and Forex Trading Update:
Monday April 15, 2019
I will update again at the end of the day.
Pre-Open market analysis
The Emini gapped above the 2900 resistance level on Friday. However, Friday closed near its open and formed a doji bar. That hesitation increases the chance of a failed breakout. The bears prefer a bear body for a sell signal bar. They therefore want today to close near its low.
If today or any day this week gaps down, Friday’s gap up will have created an island top. Island tops and bottoms are typically minor reversals. However, the Emini is at resistance and in a buy climax on the daily and weekly charts. That increases the chance of a reversal down. But, without the bears creating several bear bars closing below their midpoints, the odds favor a test of the all-time high.
When there is a gap above resistance, the Emini often goes sideways for a few days. At that point, it decides whether to resume up or reverse down. With Friday being a doji bar, there is a 50% chance of mostly sideways trading again today.
Buy climax on 60 minute chart
The 60 minute chart has rallied in a tight bull channel for 3 weeks. That is unusually long and therefore a buy climax. Consequently, the bull channel will likely evolve into a trading range this week.
There is typically a pullback that is about twice as big as the biggest pullback in the tight bull channel. Therefore, there will probably be a 50 point selloff at some point this week.
It could begin any day. The Emini might have to form a micro double top on the 60 minute chart first. If so, there would have to be at least one sideways day to create that top.
Overnight Emini Globex trading
The Emini is unchanged in the Globex session. Today is important because the bulls need to hold above 2900 to increase the chance of a new high within a month.
Also, this week is important because the bulls want follow-through buying on the weekly chart. If instead this week has a bear body on the weekly chart, it will increase the chance of a pullback next week.
If this week has a big bear body and it closes on its low, the weekly chart will have a small wedge top. That would increase the chance of at least 2 – 3 weeks of pulling back.
Because there is a buy climax on the 60 minute chart, day traders will look for a top on the 5 and 60 minute charts this week. They expect a 50 point selloff this week or next week. That would probably require 2 – 3 days down.
However, there have been many selloffs on the 5 minute chart over the past 3 weeks. Every one reversed up and led to a new high. If a 50 point sell is to start this week, it will probably begin with an unusually strong bear breakout on the 5 minute chart. That can be an extremely big bear bar or 2 – 3 very big bear bars. If traders see a strong bear breakout, they will be more eager to sell small rallies, expecting at least 2 – 3 days of lower prices.
Friday’s setups

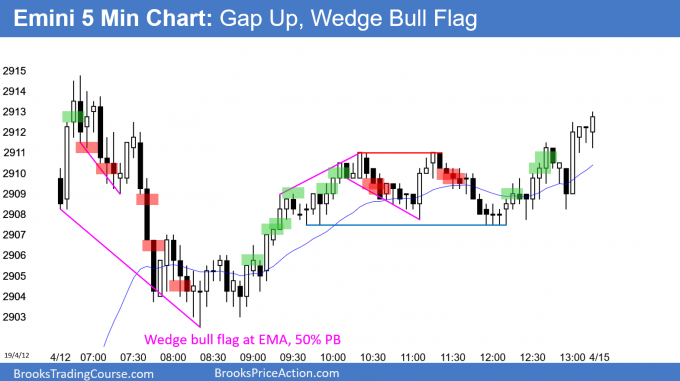
Here are several reasonable stop entry setups from Friday. I show each buy entry with a green rectangle and each sell entry with a red rectangle. I rarely also show limit order entries and entries on the close of bars. My goal with these charts is to present an Always In perspective. If a trader was trying to be Always In or nearly Always In a position all day, and he was not currently in the market, these entries would be logical times for him to enter.
EURUSD Forex market trading strategies

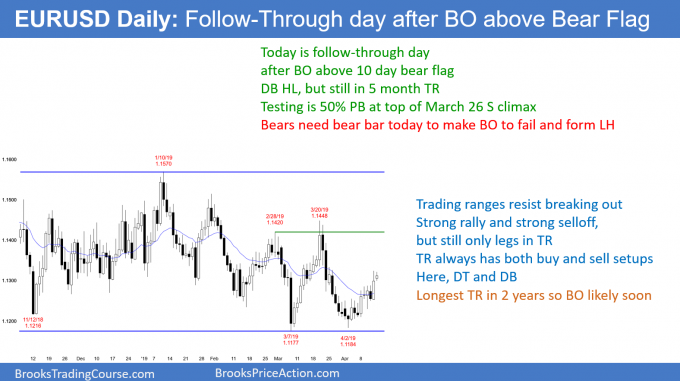
The EURUSD daily Forex chart broke above a bear flag on Friday. Today is important because the bulls need follow-through. If today is a bull bar, it will increase the probability of at least a small 2nd leg up. If it is a big bull bar closing on its high, the rally will probably continue to the top of the 5 month range.
The day is small so far after both the Asian and European sessions. It will therefore probably not get much bigger. That makes strong follow-through buying unlikely.
The bears always want the opposite. At a minimum, they want today to have a bear body. That would reduce to probability of significantly higher prices. Instead, it will make some sideways days likely. If today closes on its low, tomorrow will probably trade below today’s low.
If today has a relatively big bear body and closes on its low, Friday’s breakout will likely fail. Traders would then look for several days down this week.
Overnight EURUSD Forex trading
The EURUSD 5 minute Forex chart has been in a 20 pip range overnight. That is so small that it is even difficult for day traders to make a 10 pip scalp.
The key price today is the 1.1306 open. Whenever today is above that price, the bears will sell reversals down. This is because they want a bear body on the daily chart.
But, whenever the EURUSD Forex market is below today’s open, the bulls will buy it. This is because a bull bar on the daily chart today increases the chance of higher prices this week.
While there always can be a big breakout up or down at any time, that is unlikely today. The range has been small all day and the chart is back in the middle of its 5 month range. That is a neutral zone and it reduces the incentive for traders to move it violently higher or lower.
Summary of today’s S&P Emini futures price action and what to expect tomorrow

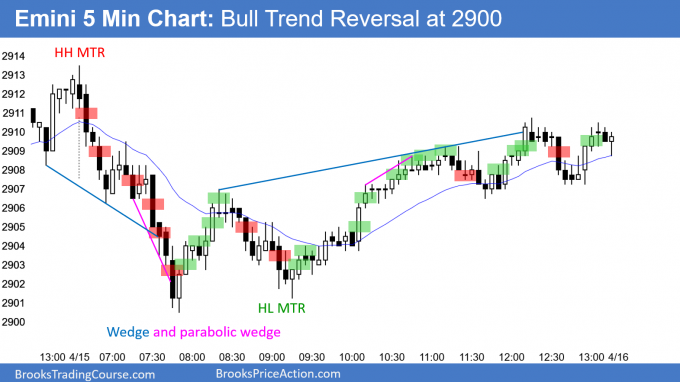
Here are several reasonable stop entry setups for today. I show each buy entry with a green rectangle and each sell entry with a red rectangle. I rarely also show limit order entries and entries on the close of bars. My goal with these charts is to present an Always In perspective. If a trader was trying to be Always In or nearly Always In a position all day, and he was not currently in the market, these entries would be logical times for him to enter.
End of day summary
The Emini sold off early and reversed up. It has done that many times over the past 3 weeks.
The 60 minute chart is in a Small Pullback Bull Trend. Since that is a buy climax, it will probably transition into a trading range this week. Traders will look for a pullback that is about twice as big as the pullbacks in the bull channel. Therefore, they will look for about 50 points down from the high.
Friday’s gap might be a measuring gap on the 60 minute chart. Therefore, the Emini might have to rally to around 2920 before beginning a 50 point selloff.
See the weekly update for a discussion of the price action on the weekly chart and for what to expect going into next week.
Trading Room
Traders can see the end of the day bar-by-bar price action report by signing up for free at BrooksPriceAction.com. I talk about the detailed S&P Emini futures price action real-time throughout the day in the BrooksPriceAction.com trading room. We offer a 2 day free trial.
Charts use Pacific Standard Time
When I mention time, it is USA Pacific Standard Time (the Emini day session opens at 6:30 am PST, and closes at 1:15 pm PST). You can read background information on the intraday market reports on the Intraday Market Update page.
Al,
Maybe once in a while, you could post a second EOD chart and show your limit order entries. I, for one, want to learn more about how and where you trade with limit orders.
Thanks, Bruce
Al,
Regarding the future emicro index contracts – although at $1.25 a tick, micro ES may be impractical for day traders with commissions, what about NQ emicro? NQ is consistently much, much greater in it’s tick-range than ES (today – NQ 240 ticks, ES 50 ticks). Therefore, the same percentage of the day’s range in NQ will have greater profit than in ES, offsetting the commission greater.
Would you agree with this analysis?
Thank you
Michael
My short experience trying to find a indecy relationship is that it will vary a lot. yesterday probably a lot of tech stocks moved. When this happens also dow moves less than SP. However, other days it is the opposite. Dow moving much more than SP and NASDAQ. I was so frustrated trading dax and one day I traded dax it almost never moved regarding dow. Next day I trade dow, then dow barely moved…
It will vary each day is my experience. However, I saw Linda Rasche referred to a correlation site where they actually have stats each day.
https://www.mrci.com/special/correl.php
I think my advice (as well I heard Al): Look at the chart you trade!
Maybe sometimes you get an early warning, however most times it confuses me when I trade Dow and look at SP and vica versa
I have to assume that the CME knows what it is doing. They are seeing further ahead than we are. Consequently, I bet that the Micro S&P Emini will be the most popular of the 4 new contracts. That can only happen if it is priced appropriately. I also think that it will force traders more into swing trading so that the overhead is a smaller percent of profit. That is a good thing. We’ll see.
Al,
I use AMP Futures and their pricing will be around $0.80 – $1.00 per contract round turn for the Micro ES. The other Dow, Nasdaq and Russell 2000 are similarly priced.
That is about what I was expecting, around twice the cost of the Emini on a percentage basis. However, that is still okay because it will force day traders to swing trade, which is an easier way for them to make money.