Trading Update: Wednesday September 15, 2021
Emini pre-open market analysis
Emini daily chart
- Emini at bull trend line with yesterday the 4th consecutive big bear bar in the 2-week selloff. That is unusual, and it therefore today should form a bull bar.
- The Emini will probably soon stop going down and begin to go sideways into next Wednesday’s FOMC announcement. That means it should soon go sideways to up for a few days.
- It is just above the 50-day MA and it might have to fall a little further first. It could also test the August 19 higher low.
- Most recent days had early selloffs. If there is an early selloff today, there will probably be a reversal back up and close above the open.
- The Emini closed below the daily bull channel again yesterday. Traders are deciding if the Emini will finally break far below the channel and evolve into a trading range. A 2nd consecutive close below the channel would increase the chance of lower prices over the next few days.
- The Emini should begin a 15% correction in September or October. It might have already begun.
- There is a small chance of a collapse far below the bull trend line over the next 2 weeks. Next week’s FOMC report could be the catalyst.
- While trends resist change, there are factors that I have discussed in the weekend blogs that are increasing the chance of the bull trend on the daily chart reversing down for a couple months.
- There is now a 50% chance that the September 2 high will remain the high for the rest of the year.
- The September 2 high was just slightly above the measured move based on the height of the pandemic crash.
- Because of the unusual streak of bull bars on the monthly chart, there should be a couple consecutive bear bars starting this month or next.
- That should result in at least a 15% correction before the end of the year.
- The Emini should fall 15% before rallying 15%.
Emini 5-minute chart and what to expect today
- Emini is up 5 points in the overnight Globex session.
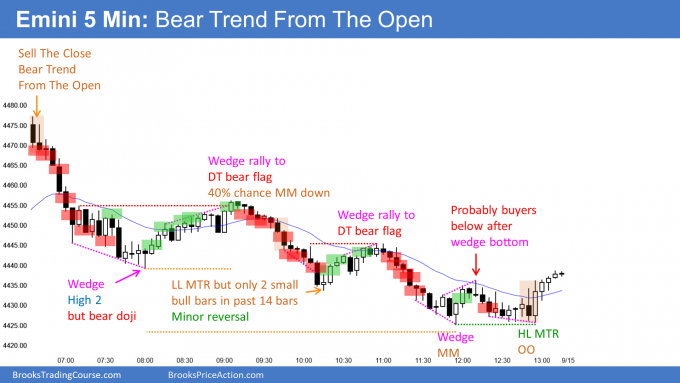
- Yesterday sold off in a Spike and Channel Bear Trend. There is therefore a 75% chance of a couple hours of sideways to up trading that begins by the end of the 2nd hour.
- The channel typically ends up being a bear leg in what will become a trading range. That channel is 30 points tall.
- If today rallies, it could take hours to get back to the start of the channel, just above 4450 and around the 60-minute EMA.
- There is a 25% chance of a strong break below yesterday’s wedge bottom and then a 30-point measured move down.
- The Emini has sold off relentlessly to the bottom of the daily and weekly channels. Also, it is just above the 50-day MA, which has been reliable support for over a year.
- The Emini will probably bounce for several days starting today or tomorrow. It might test the 4500 Big Round Number before the FOMC meeting.
- A bear trend should begin within a month. It might have already started. That increases the chance of a surprisingly big bear day in an oversold market.
Yesterday’s Emini setups

Here are several reasonable stop entry setups from yesterday. I show each buy entry with a green rectangle and each sell entry with a red rectangle. Buyers of both the Brooks Trading Course and Encyclopedia of Chart Patterns have access to a much more detailed explanation of the swing trades for each day (see Online Course/BTC Daily Setups).
My goal with these charts is to present an Always In perspective. If a trader was trying to be Always In or nearly Always In a position all day, and he was not currently in the market, these entries would be logical times for him to enter. These therefore are swing entries.
It is important to understand that most swing setups do not lead to swing trades. As soon as traders are disappointed, many exit. Those who exit prefer to get out with a small profit (scalp), but often have to exit with a small loss.
If the risk is too big for your account, you should wait for trades with less risk or trade an alternative market like the Micro Emini.
EURUSD Forex market trading strategies
EURUSD Forex daily chart

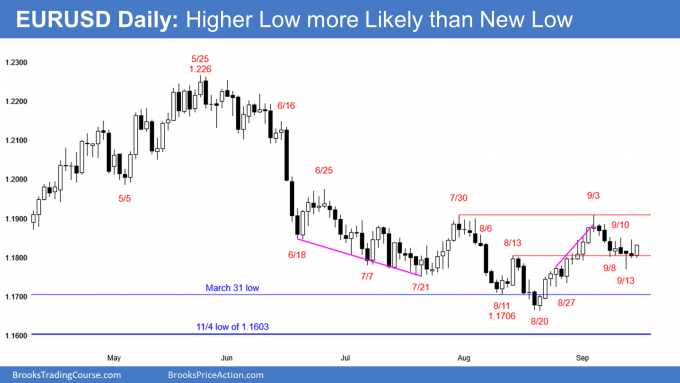
- Yesterday triggered a High 2 bull flag buy signal, but Monday had a bear body and it followed a bear bar on Friday. Also, the bear channel from the September 3 high was tight. This was a weak buy setup.
- There were sellers above Monday’s high, and yesterday closed back near the open. A doji bar is a weak entry bar.
- A weak entry bar and a weak buy signal usually does not lead to a strong trend.
- So far, today is a bull bar, but the EURUSD has been in a tight trading range for 6 days. Traders are deciding if the selloff from the September 3 high is a pullback from the August 20 rally or a resumption of the bear trend that began in May.
- 6 of the past 8 days have had bear bodies, although most were small and had prominent tails. This is therefore not as bearish as it could be.
- The late August rally was strong, and it began at the bottom of a yearlong trading range.
- The 7-day selloff was weak, and it looks more like a pullback in a bull trend than a resumption of the bear trend.
- The strong rally from support and the weak reversal down makes it more likely that the selloff will form a higher low. Traders should expect a test of the September 3 high.
- But because the EURUSD is in the middle of a 4-month trading range, the probabilities cannot strongly favor the bulls or bears. The chart is only slightly more bullish than bearish. That could quickly change with a couple big bear days closing near their lows.
- All financial markets might be sideways into next week’s FOMC announcement. It could lead to a strong move in either direction.
Summary of today’s S&P Emini futures price action and what to expect tomorrow

End of day summary
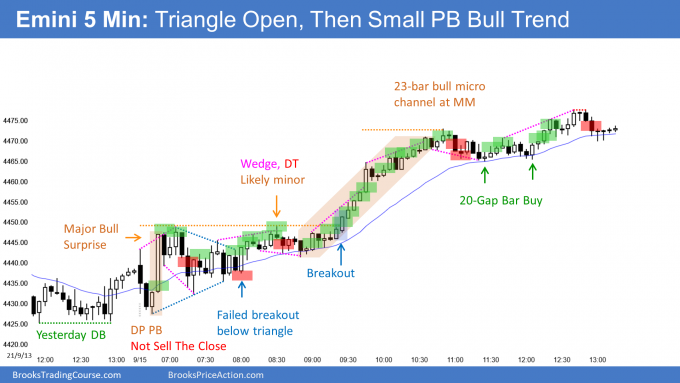
- Major Bull Surprise on the open on the 5-minute chart so likely to affect rest of day and possible next several days.
- After triangle, bulls got strong breakout.
- 23-bar bull micro channel was the 2nd most extreme micro channel in 5 years. It was therefore a buy climax, and it led to profit taking and a trading range.
- Bulls expected and got a new high of the day after the pullback.
- Today was a buy climax so should have at least a couple hours of sideways to down trading that starts by the end of the 2nd hour tomorrow. Maybe a pullback to the 60-min EMA.
- On the daily chart, yesterday was first time since pandemic crash with 4 consecutive bear bars. That made it unlikely today would be a 5th consecutive bear bar.
- Today broke above yesterday’s high and formed a 2-bar reversal.
- Today is a buy signal bar for a reversal up from the bottom of the bull channel and from just above the 50-day MA.
- However, after 4 big bear days, the first reversal up might only last 2 to 3 days. The bulls might want a double bottom before trying for a new all-time high.
- That means might go sideways into next Wednesday’s FOMC announcement.
See the weekly update for a discussion of the price action on the weekly chart and for what to expect going into next week.
Trading Room
Traders can see the end of the day bar-by-bar price action report by signing up for free at BrooksPriceAction.com. I talk about the detailed S&P Emini futures price action real-time throughout the day in the BrooksPriceAction.com trading room. We offer a 2 day free trial.
Charts use Pacific Time
When I mention time, it is USA Pacific Time. The Emini day session charts begin at 6:30 am PT and end at 1:15 pm PT which is 15 minutes after the NYSE closes. You can read background information on the market reports on the Market Update page.
Emini daily. Regarding the reference to first time since pandemic crash there have been 4 consecutive bear bars. Does the bear bar have to close with a specific range of bearishness before you count the bar as a bear bar?
On the Emini daily chart included with the weekly reports, I observed:
• 4 consecutive bear bars beginning October 23, 2020;
• 7 or 8 consecutive bear bars beginning April 26 or 27, 2021; and
• 5 consecutive bear bars beginning July 13, 2021
Thank you very much for any clarification.
I used the adjective “big” because of that. When the bars are big and close near their lows, the selling is more climactic and more likely to lead to a sharp reversal.
Hi Al,
Was selling bellow bar 2 still a valid trade even if it was close to the low of yesterday? This almost always work at least for a scalp. I didn’t sell there but I sold a 50% pullback of the 2 bear bars thinking it’s gone test down to allow the sell the close bears to get out breakeven. I didn’t expect that huge bull bar 4. I thought bar 3 is a bull trap. I was too sure 2 big bear bars means at least a little more down. I used a wide stop and it missed my stop by just one tick so, I got lucky to get out breakeven. Thank you for answers.
Thank you Dr. Brooks. I learn something from you daily. Like the DB pullback today from a DB that happened before the close yesterday? I missed that one but will try not to let that happen again. Thank you for being a educator
thanks Al always love your analysis!! can I ask why was that a “Major Bull Surprise on the open on the 5-minute chart”
the context beforehand was a trading range and I read that as a big up to be followed by big down rather than anything significant?
also can I ask the significance of the expected move “starting by the end of the 2nd hour” is that to exclude the first hours volatility?
many thanks!
Hey Al,
I watched your video on youtube, “5 Steps to Finding Today’s Trades”, and I was wondering how you created that tool bar in Powerpoint with all the drawing objects. I really want to do similar types of charts at the end of trading days.
Thanks for all the work you provide !
Cheers,
Fabi,
I created it manually, and adjusted the sizes and colors over time. Ask Richard if he can send you a PPT with only one slide where the slide has those objects on the right. If he can, you can just paste them onto any PPT slide.
Hi there.
I will post the PPT on the same page as video later today so anyone can download. It will also be in the Bonus Videos area later today for BTC/Forex members.
Also, please change your email address as advised by TD365. You will not be able to communicate with website system if you stick with this dummy address.
Hi may I know where can I download this ppt? I cannot find it in the bonus video section. Thank you
during your early days as trader how many hours you spend for analysis?
Now how many hours you spend for analysis?
That is impossible to say, but much less now than 25 – 35 years ago. Then, I was spending every waking hour trying to understand what was going on. I could not find any reliable sources and therefore had to figure everything out by myself.
Trading is both my job and my hobby. I am always in front of my computer, and I regularly look at charts after the market closes.
As you know, I create charts at the end of every day. That takes about an hour, but it is my practice. It keeps everything fresh in my mind, and it helps me quickly spot patterns as they develop while trading.
thanks for sharing.
It is very true that as long as we get immersed into charts ourselves we can react or make a decisions quickly. Or else we can see them only after it played out.
In the course videos you said that you will take all entries at each breakout sometime. Did you tried that?