Emini and Forex Trading Update:
Thursday July 23, 2020
I will update again at the end of the day.
Pre-Open market analysis
Yesterday was a trading range day that rallied to a new high late in the day. The bulls are trying to close the February gap and then get a new all-time high. They have a 50% chance before a pullback to the middle of the 3 year range. Because the daily chart is in a Small Pullback Bull Trend, traders expect sideways to up trading for at least a couple more days.
The bears still have a 50% chance of a reversal down before there is a new high. Since the Emini is so close to the all-time high, the bears will probably need to start their reversal within a week, if they are to get a reversal.
The Emini might have to stay mostly sideways for a week or more before traders decide on whether the rally will continue up to the all-time high or reverse down to the middle of the 3 year range.
Overnight Emini Globex trading
The Emini is up 3 points in the Globex session. Yesterday ended with a tight bull channel. A bull channel should be considered to be a bear flag since there is a 75% chance of a bear breakout. The breakout can come by the Emini going down or sideways.
Channels typically evolve into trading ranges. Also, all of the trading range price action of the past few days further increases the chance of trading range price action today.
The bulls want to close the February gap. The bottom of the gap is just above 3300. However, the 4 month rally is extreme and the gap was huge. This increases the chance of a reversal down for several weeks beginning within a couple weeks.
Markets typically stall when testing major resistance. That partly explains the recent trading range price action. It might continue for a few more days. But when the Emini is testing an important price, there is an increased chance of a surprisingly big trend up or down starting at any time.
Yesterday’s setups

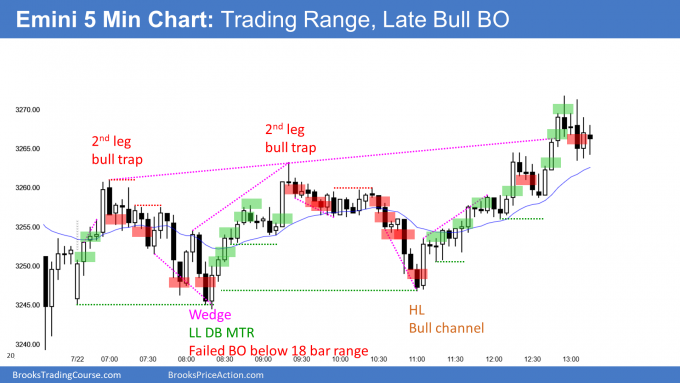
Here are several reasonable stop entry setups from yesterday. I show each buy entry with a green rectangle and each sell entry with a red rectangle. I rarely also show limit order entries and entries on the close of bars. I do not want the lines to be distracting. If they are longer, I make them dotted. But, they have to be visible, so I make the shorter ones solid. Buyers of the Brooks Trading Course and Encyclopedia of Chart Patterns have access to a much more detailed explanation of the swing trades for each day (see Online Course/BTC Daily Setups).
My goal with these charts is to present an Always In perspective. If a trader was trying to be Always In or nearly Always In a position all day, and he was not currently in the market, these entries would be logical times for him to enter.
If the risk is too big for your account, you should wait for trades with less risk or trade an alternative market like the Micro Emini.
EURUSD Forex market trading strategies

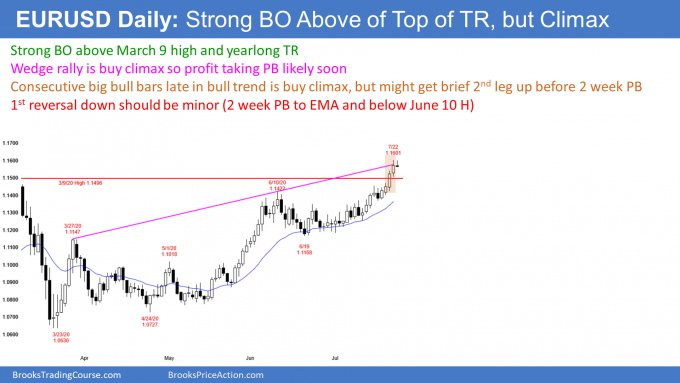
The EURUSD Forex market on the daily chart has broken out strongly to a 52 week high. But the rally has had 3 climactic legs up. It is therefore a wedge and a buy climax. That typically will attract profit takers and lead to a pullback for a couple weeks.
Furthermore, the series of 4 bull bars closing on their highs and without much overlap is a very strong breakout. When there is a strong breakout late in a bull trend, that, too, attracts profit takers. However, there is often one more brief breakout after a 1 – 3 day pullback before the pullback begins.
Traders should expect exhaustion this week or next. That typically results in approximately a TBTL (Ten Bar, Two Leg) pullback. The 1st targets are the EMA and the breakout points. Those points are the March high and the June 10 high. The pullback will probably be about 200 pips.
Overnight EURUSD Forex trading
The 5 minute chart of the EURUSD Forex market overnight failed to get above yesterday’s high and reversed down to the low of the session. Because of the exhaustive buy climaxes on the daily chart, the bulls are starting to take profits and the bears are beginning to short.
Since the 4 day rally has been strong, the EURUSD will probably have to go sideways or up a little more before the 200 pip pullback begins. However, since it is imminent, day traders will be more willing to short than they have been for the past 2 weeks.
The overnight reversal down was strong enough to make at least a small 2nd leg sideways to down likely today. But the bulls will probably buy this 1st reversal down.
With traders buying selloffs and selling rallies for at least a day or two, the EURUSD should enter a trading range. Day traders will look for 10 – 20 pip scalps up and down.
Today’s open is important. Traders will look for bear bodies on the daily chart as a sign that the 2 week pullback might be beginning. Consequently, the open of the day will be a magnet. The bears want a close at least one pip below the open to create the 1st bear day in the past 5 day.
Summary of today’s S&P Emini futures price action and what to expect tomorrow

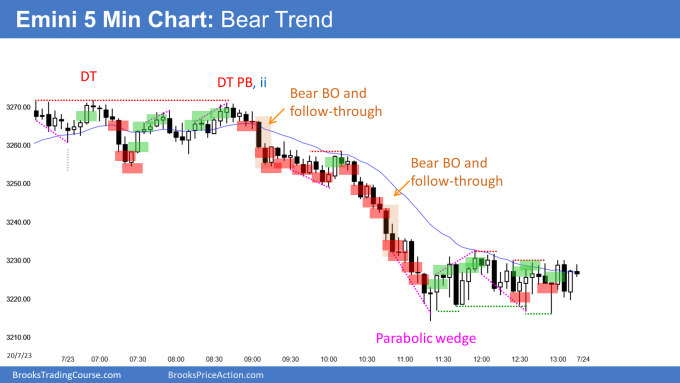
Here are several reasonable stop entry setups for today. I show each buy entry with a green rectangle and each sell entry with a red rectangle. I rarely also show limit order entries and entries on the close of bars. I do not want the lines to be distracting. If they are longer, I make them dotted. But, they have to be visible, so I make the shorter ones solid. Buyers of the Brooks Trading Course and Encyclopedia of Chart Patterns have access to a much more detailed explanation of the swing trades for each day (see Online Course/BTC Daily Setups).
My goal with these charts is to present an Always In perspective. If a trader was trying to be Always In or nearly Always In a position all day, and he was not currently in the market, these entries would be logical times for him to enter.
If the risk is too big for your account, you should wait for trades with less risk or trade an alternative market like the Micro Emini.
End of day summary
The Emini reversed down from a double top for more than a measured move down. It broke back below the February 24 high, which is the bottom of the weekly gap. The selloff also fell below the June high.
The selloff was a sell climax and a sell vacuum test of those support levels. The bulls need a strong reversal up tomorrow for traders to view this as a test. Otherwise, traders will suspect it is the end of the 4 month rally.
Today’s high was exactly at yesterday’s high and the low was below yesterday’s low. Today was therefore an outside down day. It is therefore a sell signal bar for tomorrow.
I have been saying that the Emini might sell off at the end of July because the monthly chart. June had a tail on top and the bodies were shrinking. This could be the start. Traders should find out over the next few days.
See the weekly update for a discussion of the price action on the weekly chart and for what to expect going into next week.
Trading Room
Traders can see the end of the day bar-by-bar price action report by signing up for free at BrooksPriceAction.com. I talk about the detailed S&P Emini futures price action real-time throughout the day in the BrooksPriceAction.com trading room. We offer a 2 day free trial.
Charts use Pacific Standard Time
When I mention time, it is USA Pacific Standard Time (the Emini day session opens at 6:30 am PST, and closes at 1:15 pm PST). You can read background information on the intraday market reports on the Market Update page.
Love the inclusion of premarket in today’s Market Summary. Thx!
lol! I forgot you were not EST. Love it anyway!
Hi Don,
Al has always done a pre-market open. EST/PST no difference as pre-market = pre-NYSE stock market open.