Emini buy climax but 2800 magnet above and no top yet
I will update again at the end of the day.
Pre-Open market analysis
The Emini has a buy climax on the daily and weekly charts. But, a climax can continue to rally far longer than what might seem likely. For example, the bulls could finally get a strong breakout above 2,800.
More likely, the bulls will begin to take profits this week or next. That will probably result in a 2 – 3 week pullback.
The stock market has had 8 consecutive bull bars on the weekly chart with a 10% rally many times over the past 100 years. Two thirds of the time, the market was down an average of 2% within the next month.
There is no reliable top yet on the daily chart. Yesterday had a bull body and therefore is a low probability sell signal bar. However, the risk of a big move up or down is growing. While most days continue to have trading range price action, day traders have to be ready for the 5 minute chart to begin to form trend days.
Overnight Emini Globex trading
The Emini rallied to within 2 points of 2,800 overnight and then sold off. That has been major resistance for over a year. The Emini is now down 6 points in the Globex session.
The bulls know that many bears will exit their shorts above the triple top on the daily chart. If the bulls can break above, they might get a sharp rally to a new all-time high within weeks.
They know this is unlikely. However, they keep buying until they believe they will fail. If they conclude that they cannot achieve their goal, instead of a sharp rally from bears giving up, there could be a sharp selloff from bulls giving up. There is therefore an increased chance of several strong days up or down beginning within a couple weeks. Until then, day traders will continue to look for 2 – 3 hours swings up and down.
Yesterday’s setups

Here are several reasonable stop entry setups from yesterday. I show each buy entry with a green rectangle and each sell entry with a red rectangle. I rarely also show limit order entries and entries on the close of bars. My goal with these charts is to present an Always In perspective. If a trader was trying to be Always In or nearly Always In a position all day, and he was not currently in the market, these entries would be logical times for him to enter.
EURUSD Forex wedge bear flag at bottom of trading range

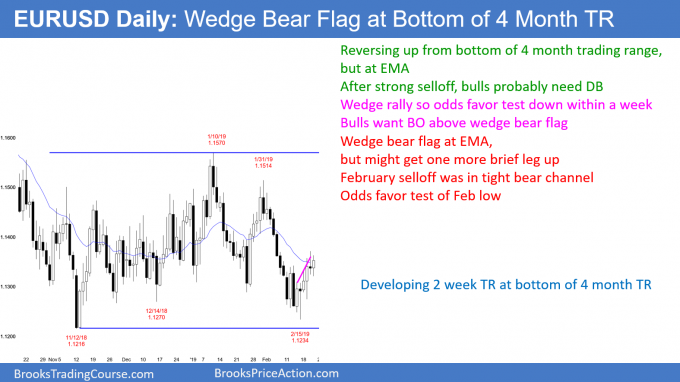
The EURUSD daily Forex chart sold off strongly to the bottom of the 4 month trading range. Since trading ranges resist breaking out, the odds favor a bull leg in the trading range.
The chart has rallied for 2 weeks in a bull channel. That channel is a micro wedge and the selloff was strong. Both factors make a test of the low likely. Therefore, the rally will probably exhaust itself in the next few days. The bulls will take profits, which will create a leg down. Because trading ranges resist breaking out, the bulls will buy again below 1.13. That will probably result in a 3 – 4 week rally from last week’s low.
The bears hope that the 2 week wedge rally is a bear flag. They will sell it, hoping for a strong break below the November low. But, trading ranges have many strong legs up and down and most reverse. Consequently, that is what is likely here.
All trading ranges on the daily chart over the past 2 years converted into trends within a couple months. Therefore, this one is overdue. As a result, traders expect a breakout up or down anytime soon, and then about a 300 pip measured move.
Overnight EURUSD Forex trading
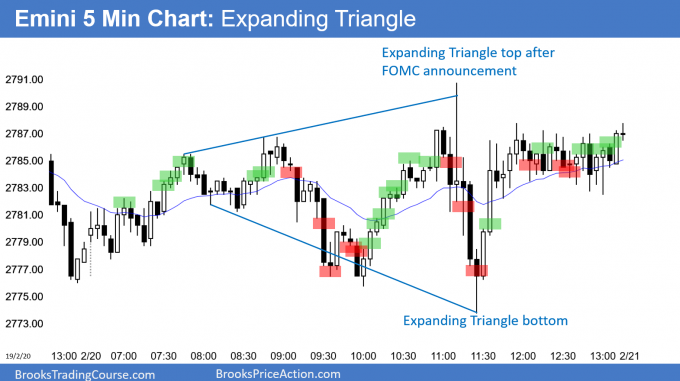
The EURUSD 5 minute Forex chart formed an expanding triangle overnight. This is a Breakout Mode pattern. In addition, the 5 minute chart has been sideways for 3 days. The legs have been big enough for 20 – 30 pip scalps.
Since the 240 minute chart is in its 3rd leg up in a wedge rally, the odds favor profit taking within a couple of days. Therefore, if there is a bull breakout above the triangle, the bulls will probably take profits around 1.14. That is about a 50% retracement of the February selloff. If the bears get a reversal down, they will take profits below 1.13.
If today goes above yesterday’s high, today will be another outside up day, like Tuesday. However, the odds are that the 2 week tight trading range will continue today. There will be sellers above yesterday’s high, just like there were buyers below yesterday’s low.
Summary of today’s S&P Emini futures price action and what to expect tomorrow

Here are several reasonable stop entry setups for today. I show each buy entry with a green rectangle and each sell entry with a red rectangle. I rarely also show limit order entries and entries on the close of bars. My goal with these charts is to present an Always In perspective. If a trader was trying to be Always In or nearly Always In a position all day, and he was not currently in the market, these entries would be logical times for him to enter.
End of day summary
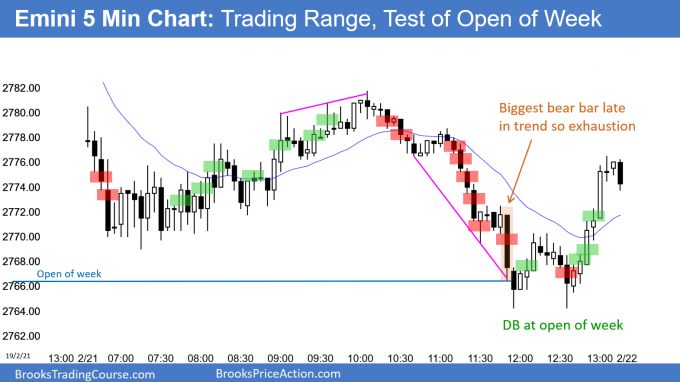
The Emini formed a trading range day. There was a strong selloff that tested the open of the week. However, the bulls bought the test and the day closed in the middle of the range.
Tomorrow is Friday and the bulls want a 9th consecutive bull trend bar on the weekly chart. That is rare. There has only been one streak of more than 9 weeks in 20 years. Consequently, probably either tomorrow will close below this week’s open or next week will have a bear body.
Since this week’s open is just below today’s low, it is a magnet tomorrow. This is especially true in the final hour. If the bears get a bear body on the weekly chart, the Emini will probably begin to pull back for 2 – 3 weeks.
See the weekly update for a discussion of the price action on the weekly chart and for what to expect going into next week.
Trading Room
Traders can see the end of the day bar-by-bar price action report by signing up for free at BrooksPriceAction.com. I talk about the detailed S&P Emini futures price action real-time throughout the day in the BrooksPriceAction.com trading room. We offer a 2 day free trial.
Charts use Pacific Standard Time
When I mention time, it is USA Pacific Standard Time (the Emini day session opens at 6:30 am PST, and closes at 1:15 pm PST). You can read background information on the intraday market reports on the Intraday Market Update page.
Al,
Why isn’t the fourth bar on 5min chart a sell entry bar? It is closing on it’s low, and the body is not small.
Tnx.
Hi Alireza,
If you were watching market at the time bar 4 formed you would have seen a lot of buying pressure. The big tail on top shows just how bullish it was. Despite that, you could argue Always In Short on bar close, but looking to left the previous few days have been trading range days – so good chance bar 4 is exhaustion. Conclusion? Wait. ; )
On my 4000 tick chart, the bar 4 bottom was a wedge, with lots of bullish action appearing as price went lower.
Quick question regarding TICKS indicator. I assume this is a new one or may it have another name on another platform? (I have some called higher high value and an opposite one. ) I remember I read Elders books (in my search to know everything so I had to make money, I thought 5 books gave 5x return also 🙂 ) I know he talked about new highs and lows etc. Is there some of his indicators i see I have (ray/impulse) that have some of the same use?
I watch trading room and I heard you have said several times that ticks have a new bottom (like yesterday around 1000) and continue saying; so probably price doesn’t have seen the bottom yet (or similar). How come if Ticks seems to have a new low (and very low is near 1000 or?) and like 45 min left of the day.
Maybe this is the wrong place and maybe the question is not so clear. I hope some makes sense..
Ah, got an answer in the webinar. I misunderstood ticks vs new lows.