Emini buy signal bar for November head and shoulders bottom
I will update again at the end of the day.
Pre-Open market analysis
As I said before yesterday’s open, yesterday was likely to form an early low of the day. The day closed on its high and it is a buy signal bar for a head and shoulders bottom on the daily and 60 minute charts. That is also a higher low major trend reversal buy setup.
The bulls want today to go above yesterday’s high. That would trigger the buy signal. Since the bears always want the opposite, they will try to form an inside day today.
Last week was a sell signal bar on the weekly chart. Since last week’s candle had a bull body, it was a weak sell signal bar. I said last weekend that the sell signal would trigger, but there would probably be buyers below. Furthermore, I have been saying for several weeks that the Emini would test the October 17 lower high, selloff to around last year’s close, and try to reverse up from a higher low major trend reversal. So far, everything is following the likely path.
But, yesterday is the 7th bar in a bear micro channel. That increases the chance that the 1st reversal up will stall within 2 – 3 days. Even if it does, the odds still favor another test of the October 17 lower high. In addition, a break above that high is more likely than a break below the February low.
Today is Friday and last week’s 2717.00 low is the most important price. The bulls want today to close above that low. Closing above the low of a weekly sell signal bar is a sign of weak bears and strong bulls. The overall chart favors the bulls and therefore a close above last week’s low.
Overnight Emini Globex trading
The Emini is down 24 points in the Globex market. The day session yesterday was in a bull channel, which is always a bear flag. Today’s open will probably break below yesterday’s bull trend line.
This will create a big gap down and an open in the middle of yesterday’s range. Because yesterday had a big range and today is opening in its middle, there is an increased chance of an inside day. When that is the case, day traders will look for reversals. They will sell rallies to around yesterday’s high and buy selloffs to near yesterday’s low. This typically results in a trading range.
Today will open near last week’s low. If there is a trading range today, the Emini might oscillate around 2717 all day. In addition, if the Emini is within 10 points of last week’s low in the final 2 hours, it will probably get drawn to it to test it one last time.
60 minute chart head and shoulders bottom
Although yesterday was a strong bull trend day, the 60 minute chart has been in a tight bear channel for 7 days. The 1st reversal up is usually minor. That means that the bulls will probably need a test down before they can create a sustained rally.
Today’s gap down on the 5 minute chart will give the bulls the opportunity to form a higher low. That would increase their chance of a successful reversal up from the month-long head and shoulders bottom on the 60 minute chart (also present on the daily chart).
Yesterday’s setups
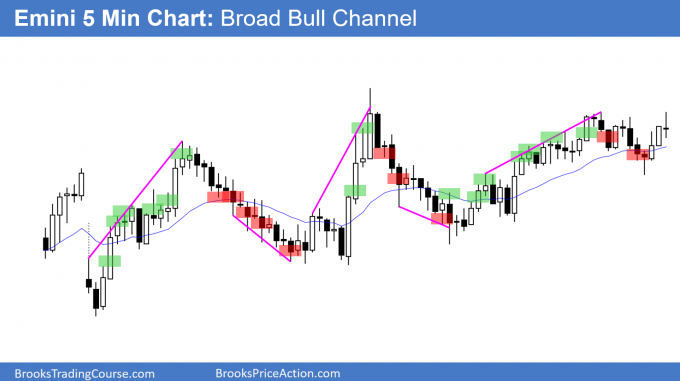
Here are several reasonable stop entry setups from yesterday. I show each buy entry with a green rectangle and each sell entry with a red rectangle. I rarely also show limit order entries and entries on the close of bars. My goal with these charts is to present an Always In perspective. If a trader was trying to be Always In or nearly Always In a position all day, and he was not currently in the market, these entries would be logical times for him to enter.
EURUSD Forex chart weekly buy signal bar for wedge bottom
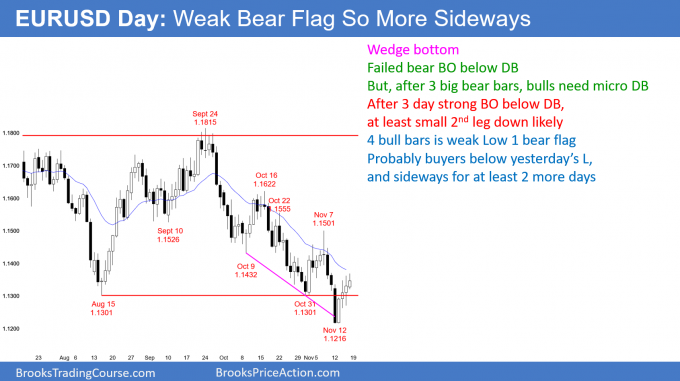
After a strong breakout below the August/October double bottom, the EURUSD daily Forex chart has reversed up for 4 days. There is also a wedge bottom.
The EURUSD daily Forex chart is reversing up from a wedge bottom and a failed breakout below a 2 month double bottom. In addition, the rally has had 4 consecutive bull trend bars. However, it follows an even stronger leg down. Consequently, the bulls will probably need a small double bottom if they are to create a successful reversal.
The bears see the 4 day rally as a bear flag. They know that it is weak compared to the 3 big bear bars that broke below the double bottom. But, they also know that it is difficult to resume a bear trend immediately after 4 bull bars.
If today trades below yesterday’s low, it will trigger a sell signal. Since the sell setup has 4 bull bars, it is a low probability pattern. That means that there will be more buyers than sellers below yesterday’s low. The bulls will likely get at least a small 2nd leg up. This would form a small double bottom. It therefore would increase the chances of the bulls getting a swing up to the October 16 major lower high over the next 2 months.
However, if there is a micro double bottom and the reversal up is weak, the bears will again try to resume the bear trend. This would then be a Low 2 sell signal and it would have a better chance of success.
Weekly chart has buy signal
The weekly chart has a yearlong wedge bull flag. The bulls want a strong buy signal bar this week. That means that they want the week to close on its high. At a minimum, they want a buy body, which means a close above the 1.1326 open of the week. The EURUSD is currently only a few pips above that price. That will be the key price all day.
Even if the bulls get a strong buy signal bar, the 8 week bear channel on the weekly chart is tight. Therefore, the 1st reversal up will probably be minor. Consequently, any rally would probably stall after a couple of weeks. A weak buy setup typically leads to a trading range for at least a few weeks.
Overnight EURUSD Forex trading
The EURUSD 5 minute Forex chart has tested the open of the week repeatedly over the past 4 hours and keeps reversing up. This is a sign that traders believe that the weekly chart is important today.
While the bulls would like a big bull body on the weekly chart, that would require a 50 pip rally today. So far, the range is small, and the bars are small and sideways with prominent tails. Traders are more concerned about simply getting a bull body on this week’s candlestick than creating a strong buy signal bar.
However, because of the importance of this week’s close, there is an increased chance of a bull trend day today. Traders will probably buy dips all day.
Summary of today’s S&P Emini futures price action and what to expect tomorrow
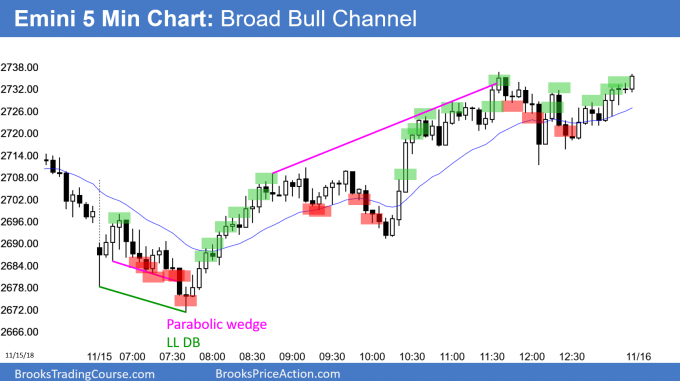
Here are several reasonable stop entry setups for today. I show each buy entry with a green rectangle and each sell entry with a red rectangle. I rarely also show limit order entries and entries on the close of bars. My goal with these charts is to present an Always In perspective. If a trader was trying to be Always In or nearly Always In a position all day, and he was not currently in the market, these entries would be logical times for him to enter.
Today triggered the buy signal for the head and shoulders bottom on the daily chart. But, there is a 7 day bear micro channel. That will probably limit the rally over the next few days. The result will likely be a continuation of the 4 day trading range for at least a couple more days. Many bulls will want a 2nd buy signal before buying.
See the weekly update for a discussion of the price action on the weekly candlestick chart and for what to expect going into next week.
Trading Room
Traders can see the end of the day bar-by-bar price action report by signing up for free at BrooksPriceAction.com. I talk about the detailed S&P Emini futures price action real-time throughout the day in the BrooksPriceAction.com trading room. We offer a 2 day free trial.
Charts use Pacific Standard Time
When I mention time, it is USA Pacific Standard Time (the Emini day session opens at 6:30 am PST, and closes at 1:15 pm PST). You can read background information on the intraday market reports on the Intraday Market Update page.


