Emini and Forex Trading Update:
Monday May 6, 2019
I will update again at the end of the day.
Pre-Open market analysis
I wrote last week that there were consecutive outside bars on the daily chart. I said that it would probably lead to a couple legs of sideways to down trading over the next 2 – weeks.
Furthermore, I said the pullback would likely test the most recent breakout point. That is the 2866.00 March 21 high. The big gap above the March 29 high is also a magnet.
Did I know in advance that Trump would create worries about the China trade deal yesterday? Of course not. However, there is always some news item that happens when the stock market makes a move. The move was going to happen anyway. Since news reporters believe that news causes everything, they do not understand that the chart already told us that the bulls were beginning to take profits last week.
Yes, the news will make today’s gap bigger, but the profit taking began before the news and it will probably continue down to those targets. The China news is a coincidence, not a cause.
The Emini will still likely make a new high in May or June. Can the Emini have a huge bull trend day today that continues far above the 2956.00 high this week? Probably not. Typically, the Emini goes sideways for at least a couple weeks when it tests a major prior high. Consequently, this selloff is probably just another example of this common tendency.
Micro Emini begins trading today
I first posted this over the weekend. The CME will start trading the micro Emini contracts today (S&P, Nasdaq, Russell, and Dow). The micro Emini S&P is 1/10th the size of the Emini. It might take a few weeks for the volume to get big. However, it will be tightly arbitraged with the Emini and therefore it should track it almost exactly.
The advantage is for beginning traders. There are often setups in the Emini that require too much risk for a small account. However, the micro contract should allow most traders to stay within their comfort zone. The small size will give traders a good opportunity to learn how to trade with much less risk. They then will be better able to focus on how to trade without constantly worrying about money. That is a very good thing.
Even if the round turn commission is only around $1, that is a problem for scalpers. In general, a trader should not take any trade where his transaction cost is more than 10% of his expected profit. If the cost is $1, a trader should not scalp for less than 2 points.
Most traders should not scalp at all. A reasonable minimum goal with the mini Emini S&P is 4 points profit. For a day trader, that is a swing trade, and traders should always have swing trading as their goal.
Once they are consistently profitable, they can add scalping if they would like. However, most successful day traders are swing traders.
Overnight Emini Globex trading
The Emini is down 44 points in the Globex session. It will therefore have a big gap down opening. However, the daily, weekly, and monthly charts are in bull trends. This is probably the start of a 2 – 3 week pullback and not a bear trend. Therefore, the bears will probably be disappointed by the lack of sustained selling. For example, although there was an immediate collapse on the news yesterday, the Emini has been sideways overnight.
When there is a big gap down, there is only a 20% chance of a big bull or bear trend day from the open. There is usually a trading range for the 1st 60 – 90 minutes. The bulls look for a double bottom or wedge bottom and then a swing up. However, the bears want a double top or wedge top and then a swing down. That trading range open represents balance and uncertainty. It typically reduces the chance of a relentless, strong trend day.
Friday’s setups

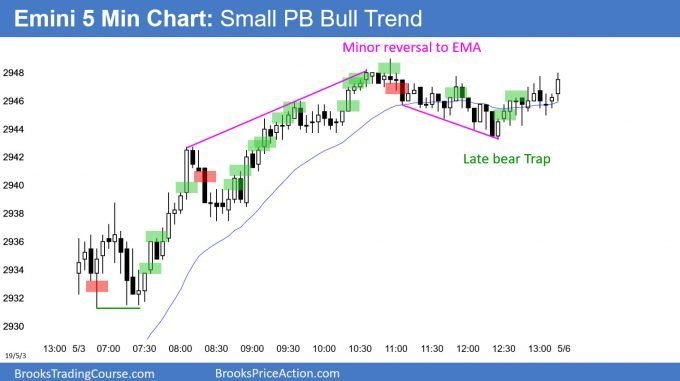
Here are several reasonable stop entry setups from Friday. I show each buy entry with a green rectangle and each sell entry with a red rectangle. I rarely also show limit order entries and entries on the close of bars. Buyers of the Brooks Trading Course have access to a much more detailed explanation of the swing trades for each day.
My goal with these charts is to present an Always In perspective. If a trader was trying to be Always In or nearly Always In a position all day, and he was not currently in the market, these entries would be logical times for him to enter.
EURUSD Forex market trading strategies

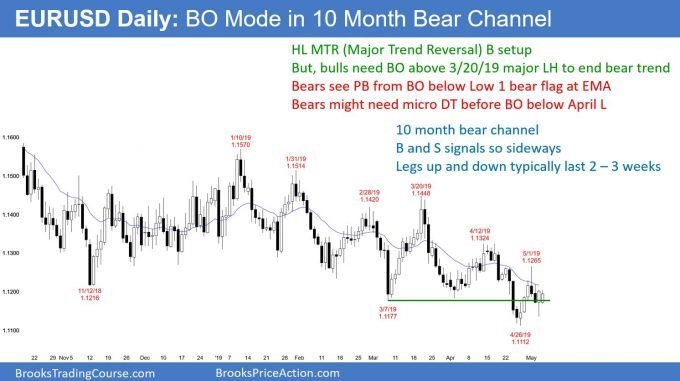
The EURUSD daily Forex chart formed a bull reversal bar on Friday. It was a also a higher low after the April 26 reversal up from below the 5 month trading range. This is a higher low major trend reversal buy setup.
However, there have been many major buy setups in the past 10 months of this bear channel. Trends resist change. Consequently, most major setups turn out to be minor. Every leg up and down for 10 months has reversed within 2 – 3 weeks. Traders should expect this to continue until there is a break above or below the bear channel. Until there is, the trend will continue in a bear channel.
The bears see the past 2 days as a pullback from Wednesday’s reversal down from the 20 day EMA. There is therefore a sell signal in addition to the buy signal. When that is the case, the chart is in Breakout Mode. It typically goes sideways. The bulls usually want to see a micro double bottom and the bears want a micro double top. Therefore, the daily chart will probably be sideways for a few days.
Overnight EURUSD Forex trading
The EURUSD 5 minute Forex chart has been in a 30 pip range overnight. While Friday was a buy signal bar on the daily chart, the bulls so far today have been unable to go above Friday’s high to trigger the buy signal.
They want to either trigger the buy signal today or close the day near the high. That would turn today into another buy signal bar tomorrow. They therefore will buy pullbacks today. If there is a strong break above Friday’s high, they will swing trade. With the overnight session being quiet, today will probably remain a trading range day.
The bears do not want the buy signal to trigger. If it does trigger, they want it to fail. As a result, they will sell rallies to around Friday’s high. If they can get today to close near its low, today was be a minor sell signal bar on the daily chart.
When there is both a reasonable buy and sell setup, the daily chart is in breakout mode. It usually has to go sideways for several days.
Summary of today’s S&P Emini futures price action and what to expect tomorrow

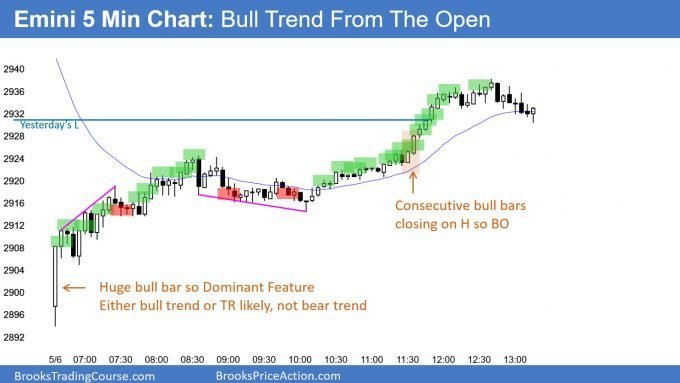
Here are several reasonable stop entry setups for today. I show each buy entry with a green rectangle and each sell entry with a red rectangle. I rarely also show limit order entries and entries on the close of bars. Buyers of the Brooks Trading Course have access to a much more detailed explanation of the swing trades for each day.
My goal with these charts is to present an Always In perspective. If a trader was trying to be Always In or nearly Always In a position all day, and he was not currently in the market, these entries would be logical times for him to enter.
End of day summary
The Emini had a huge gap down and then a strong reversal up. It was a Bull Trend From The Open and the Emini rallied to above yesterday’s low, closing the gap. Since it formed a bull bar on the daily chart, it is a High 2 bull flag buy signal bar for tomorrow.
Today’s rally was exceptionally strong. It was strong enough to neutralize last week’s oo top sell signal. There is now a 50% chance of a new all-time high this week.
There is also a 50% of a pullback to below the March 21 high within a couple weeks. Even if the bears get their pullback, the odds favor a new all-time high in May.
See the weekly update for a discussion of the price action on the weekly chart and for what to expect going into next week.
Trading Room
Traders can see the end of the day bar-by-bar price action report by signing up for free at BrooksPriceAction.com. I talk about the detailed S&P Emini futures price action real-time throughout the day in the BrooksPriceAction.com trading room. We offer a 2 day free trial.
Charts use Pacific Standard Time
When I mention time, it is USA Pacific Standard Time (the Emini day session opens at 6:30 am PST, and closes at 1:15 pm PST). You can read background information on the intraday market reports on the Intraday Market Update page.