Published 7:15 a.m. PST
The Emini began with a trading range open, as expected. Day traders will look to scalp until there is a strong breakout with follow-through in either direction. If there is, they will then swing trade part of their position. Scalpers will probably have to enter mostly with limit orders and use wide stops and scale in. Most traders should not do this and instead patiently wait for stop entry setups or strong breakouts.
At the moment, the Emini is always in long, but it could quickly become always in short with consecutive strong bear bars and a breakout below yesterday’s low. Even though the bulls have a slight edge, it is very small. Most traders are waiting for more information. They want to buy lower and sell higher because this is a continuation of yesterday’s tight trading range.
My thoughts before the open
New Year’s Eve is usually one of the quietest days of the year and will probably be mostly within tight trading ranges. However, it sometimes can have a surprisingly strong swing. Yesterday had a series of 60 minute gap bars, which is a pullback in the 60 minute bull trend, so the odds are that today will try to rally. Also, the Emini is only about 10 points below the all-time high, which is an obvious magnet, especially in a year that has had many all-time highs. It is important, though, to realize that when something is so obvious, the market will often do the opposite.
Summary of today’s price action and what to expect tomorrow
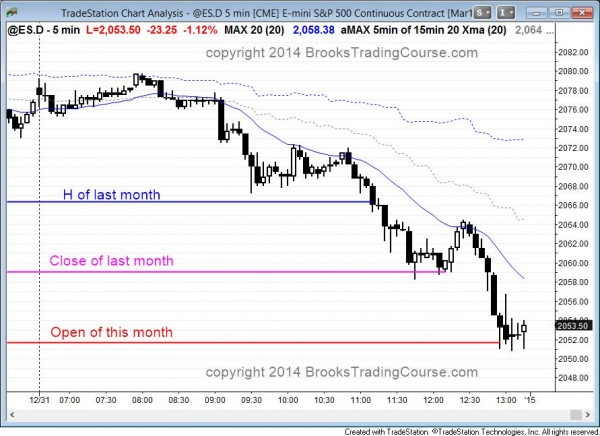
Today is the last day of the month (and year!). Although the day started out as a tight trading range, once it was clear that it would not hit the all-time high, it reversed down to the monthly support levels below. It closed just above the open of the month and created a big doji candle on the monthly chart.
Besides being the last day of the year, it is also the last day of the month. This means that monthly support and resistance are important. The bulls failed to rally the Emini to a new all-time high and gave up. The bears were then able to drive the market down to monthly support levels. The month closed near its open and created a big doji candle on the monthly chart.
The monthly cash index has not touched the 20 month moving average in 30 months. This has happened only once before in the past 50 years In 1996, it held above the average for 32 months and then corrected 23%. Although the stock market can always do things it has never done before, it usually does what it has done. This means that the odds are high (maybe 60% or more) that it will fall to the monthly moving average within the next few months.
Today is a bear channel with consecutive sell climaxes. There is a 70% chance of at least a 2 hour rally on Friday, although there might be some follow-through selling in the first couple of hours.
See the weekly update for a discussion of the weekly chart and for what to expect going into next week.
Traders can see the end of the day bar-by-bar price action report by signing up for free at BrooksPriceAction.com. I talk about the detailed Emini price action real-time throughout the day in the BrooksPriceAction.com trading room, and a 2 day free trial is available.
When I mention time, it is USA Pacific Standard Time (the Emini day session opens at 6:30 am PST, and closes at 1:15 pm PST). You can read background information on the intraday market reports on the Intraday Market Update page.
