Emini and Forex Trading Update:
Tuesday June 30, 2020
I will update again at the end of the day.
Pre-Open market analysis
Yesterday traded below last week’s low. This triggered a Low 2 top sell signal on the weekly chart.
However, it immediately reversed up into a bull trend day. Yesterday is now a buy signal bar on the daily chart for today.
The Emini is reversing up from around the bottom of a 4 week trading range in a bull trend. Also, there are 3 consecutive shrinking expanding triangles on the 60 minute chart. While difficult to see, they are there. The failed bear breakout increase the chance of a rally. Traders expect higher prices today or tomorrow. But traders might wait for Thursday’s unemployment report before they will look for a breakout.
Because the Emini has been in a trading range for a month, it is neutral. The bulls want a rally up into the gap on the weekly chart above the February 24 high. But the bears want a breakout below the trading range and a measured move down to around 2700.
They each have about a 50% chance. The probabilities change a little every day. For example, today is slightly more bullish after yesterday’s reversal up.
Since today is the final day of the month and of the quarter, monthly support and resistance are important. The Emini has been oscillating around the open of the month for 4 days. It will probably close around the month’s open and have either a small bull or bear body on the monthly chart.
The higher up in the June range that it closes, the better chance the bulls have of higher prices in July. The nearer today’s close is to the low of the month, the more likely July will trade down.
Overnight Emini Globex trading
The Emini is down 10 points in the Globex session. It will therefore be within about half of a day’s range of the open of the month. If it is within 20 points of the open of the month in the final hour, it will probably test the open of the month one more time.
Yesterday is a buy signal bar on the daily chart and the context is good for the bulls. Today will probably go above yesterday’s high and trigger the buy signal. But, because the Emini is in a trading range, there is a reduced chance of a big rally above yesterday’s high.
This is similar to yesterday when there was a sell signal bar on the weekly chart. I said before the open that it would probably go below last week’s low and trigger the sell signal. It did, and it reversed up.
With the daily chart in Breakout Mode, there is a 50% chance that if the Emini triggers the buy signal today, it will reverse back down within a day or two. Traders might be waiting for Thursday’s unemployment report before looking for a breakout of the 5 week trading range.
Yesterday’s setups

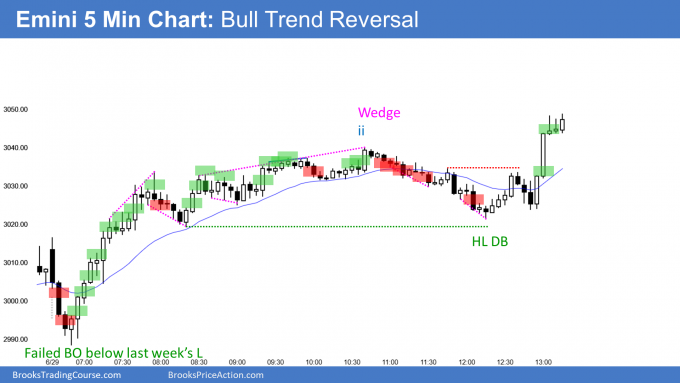
Here are several reasonable stop entry setups from yesterday. I show each buy entry with a green rectangle and each sell entry with a red rectangle. I rarely also show limit order entries and entries on the close of bars. I do not want the lines to be distracting. If they are longer, I make them dotted. But, they have to be visible, so I make the shorter ones solid. Buyers of the Brooks Trading Course and Encyclopedia of Chart Patterns have access to a much more detailed explanation of the swing trades for each day (see Online Course/BTC Daily Setups).
My goal with these charts is to present an Always In perspective. If a trader was trying to be Always In or nearly Always In a position all day, and he was not currently in the market, these entries would be logical times for him to enter.
If the risk is too big for your account, you should wait for trades with less risk or trade an alternative market like the Micro Emini.
EURUSD Forex market trading strategies

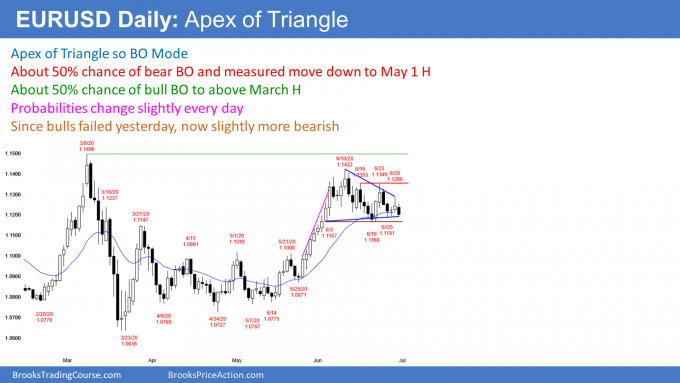
The EURUSD Forex market on the daily chart has been sideways for 4 weeks after a strong rally. It is in a tight trading range, which is a Breakout Mode Pattern. That tight trading range currently is also a triangle.
Traders believe that until there is a successful breakout, both the bulls and bears have about a 50% chance of success. The probabilities change every day, but cannot get far from 50%. If they did, the market would not be still going sideways. Today is slightly more bearish because the bulls failed to get a strong reversal up yesterday.
Traders look for a measured move up or down based on the height of the range. The bears want a test of the May 1 high and the bulls want a move above the March high. It is important to remember that the 1st breakout fails 50% of the time.
The EURUSD might be waiting for Thursday’s unemployment report before breaking out. In the meantime, traders are holding trades for only a day or two.
Overnight EURUSD Forex trading
The 5 minute chart of the EURUSD Forex market traded below yesterday’s low but reversed up from above last week’s low. Last week was an inside bar on the weekly chart. So far, this week is a 2nd consecutive inside bar.
The daily ranges have been small. Day traders have been scalping for 10 – 20 pips as they wait for a strong trend up or down.
A strong trend can begin at any time. But until there is a breakout, there is no breakout. Day traders will continue to scalp until there is a series of consecutive big bars up or down. That would be a sign that the breakout might be beginning.
Summary of today’s S&P Emini futures price action and what to expect tomorrow

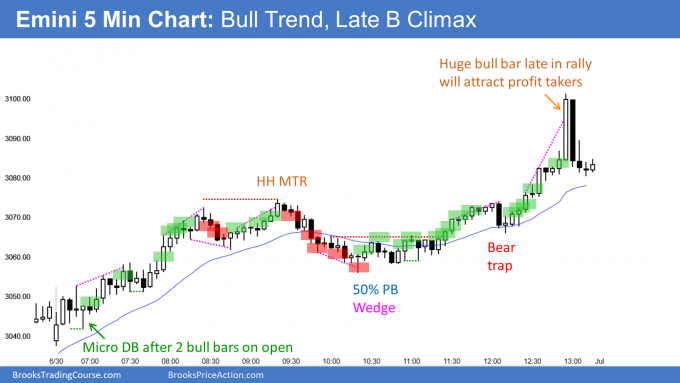
Here are several reasonable stop entry setups for today. I show each buy entry with a green rectangle and each sell entry with a red rectangle. I rarely also show limit order entries and entries on the close of bars. I do not want the lines to be distracting. If they are longer, I make them dotted. But, they have to be visible, so I make the shorter ones solid. Buyers of the Brooks Trading Course and Encyclopedia of Chart Patterns have access to a much more detailed explanation of the swing trades for each day (see Online Course/BTC Daily Setups).
My goal with these charts is to present an Always In perspective. If a trader was trying to be Always In or nearly Always In a position all day, and he was not currently in the market, these entries would be logical times for him to enter.
If the risk is too big for your account, you should wait for trades with less risk or trade an alternative market like the Micro Emini.
End of day summary
The Emini today rallied above yesterday’s high, as expected. This triggered the buy signal on the daily chart. After rallying for 3 hours, it entered a trading range.
There was strong trend resumption up at the end of the day. The Emini briefly got above the 3100 Big Round Number in the final minutes, but pulled back sharply on profit taking. This climactic finish was because today was the last day of the month and of the 2nd quarter.
When there is a buy climax into the close, there is a 75% chance of trading range trading tomorrow that starts by the end of the 2nd hour and lasts at least 2 hours. It might have begun with the last climactic reversal. The uncertainty regarding Thursday’s unemployment report also increases the chance of trading range price action tomorrow.
I said yesterday that the Emini would be higher today and maybe Wednesday as well. After another strong day today, tomorrow has an increased chance trying to get above 3100 again.
June was a doji bar on the monthly chart
Today was the last trading day in June. June had a bull body on the monthly chart. However, it was only a doji bar. In addition, its body was much smaller than May’s, which was smaller than April’s. While bullish, the shrinking bodies represent a loss of momentum now that the Emini is near the top of the 2 1/2 year trading range.
A strong rally is good for the buys, but a doji at the top of the trading range on the monthly chart is neutral. This confusion gives no direction for July. Traders assume it will not go far up or down.
While this month is a sell signal bar for a reversal down from the top of the range, its bull body and the 3 consecutive bull bodies make is a weak sell setup. There will probably be buyers not too far below the July low.
If there is a reversal down, it will probably only last a month or two. There is no sign that the 2 1/2 year trading range is about to end.
See the weekly update for a discussion of the price action on the weekly chart and for what to expect going into next week.
Trading Room
Traders can see the end of the day bar-by-bar price action report by signing up for free at BrooksPriceAction.com. I talk about the detailed S&P Emini futures price action real-time throughout the day in the BrooksPriceAction.com trading room. We offer a 2 day free trial.
Charts use Pacific Standard Time
When I mention time, it is USA Pacific Standard Time (the Emini day session opens at 6:30 am PST, and closes at 1:15 pm PST). You can read background information on the intraday market reports on the Market Update page.
Hello Al,
I watched your 08C video about ii setups and on the 30 min chart at the end of the day there was ii setup. Would you please provide a comment regarding context? Do we need to expect a reversal?
Thank you in advance.
Hi Sergey.
Al’s report above covers market context. You should be able to get a satisfactory answer to your query from that.
With a good looking monthly bull bar the chances are now better for going up. Is this true even if the market pullbacks over the next couple days prior to a breakout though? Looks like we could potentially be setting up for a triangle pattern as well if we have a pullback over the next couple days.
I tend to look at time frames independently. The bull bar in June had a small body and it represents a loss of momentum.
The daily chart has tried to reverse down 3 times and failed. That usually means it will go the other way.
I think the daily chart looks more bullish than the monthly chart, but both are bullish. If I am buying, I am buying because of what I see on the daily chart, not the monthly chart.
But the daily chart is in a trading range. It could reverse down again before breaking above the June high. Until there is a breakout, there is no breakout. That means that the probability of an breakout up or down cannot be much more than 55% while we wait. Now, it is 55% for the bulls.