Emini head and shoulders bottom but bear micro channel
I will update again at the end of the day.
Pre-Open market analysis
By going above Thursday’s high, Friday triggered a buy signal on the daily chart. However, there is a 7 bar bear micro channel and Friday was the 1st pullback. Typically, the rally will pull back within 3 days. Therefore, the odds are against a strong move up this week.
The Emini has been sideways for 4 days, despite the big bars. The tight trading range will probably continue today and tomorrow, even if the market rallies for another day or two. Although there is a head and shoulders bottom on the daily chart, the 7 bar bear micro channel will make many bulls wait for a 2nd entry buy signal.
While Thursday was a buy signal bar, it was huge. The stop for the bulls is therefore far below. Many bulls do not want risk that much. As a result, many will wait to buy a pullback and did not buy on Thursday. Furthermore, Thursday’s high was at the 20 day EMA, which is resistance. Consequently, the odds favor at least a small pullback or sideways move this week.
Overnight Emini Globex trading
The Emini is down 11 points in the Globex session. While Friday closed near its high, the day had several swings up and down. In addition the 2 day rally is a the top of a 4 day trading range and at the 20 day EMA. Therefore, more sideways trading is likely today.
Friday’s setups
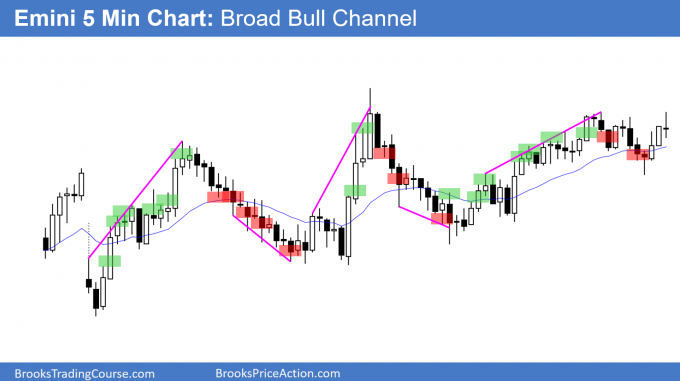
Here are several reasonable stop entry setups from Friday. I show each buy entry with a green rectangle and each sell entry with a red rectangle. I rarely also show limit order entries and entries on the close of bars. My goal with these charts is to present an Always In perspective. If a trader was trying to be Always In or nearly Always In a position all day, and he was not currently in the market, these entries would be logical times for him to enter.
EURUSD daily Forex chart has buy climax in bear channel
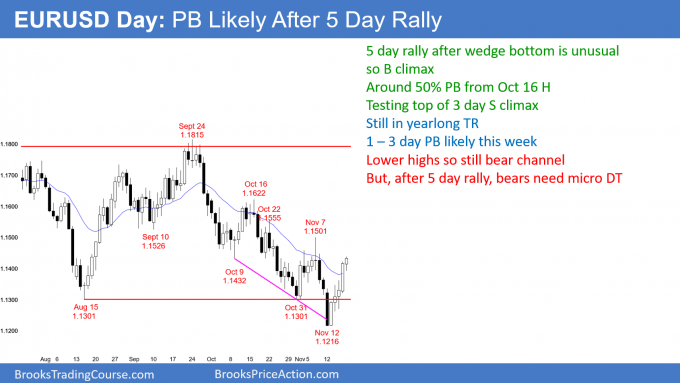
Today so far is the 5th consecutive bull trend day in a bull trend reversal up from a wedge bottom. However, it is still below the November 7 lower high and therefore in a bear channel.
Over the past year, every 5 – 6 day trend up or down pulled back for 1 – 3 days. Therefore, the current 5 day rally will probably pull back this week. However, even though it is a small buy climax, it is also a sign of strong bulls. Consequently, the bulls will buy the 1st 1 – 3 day pullback.
The bulls need to get above the November 7 lower high to make traders believe that the bear trend has ended. If the EURUSD then sells off again, they will need a higher low at around the October 31 low for a major trend reversal buy setup. At that point, the bear trend would have evolved into a trading range.
The bulls need a strong break above the October 16 major lower high before traders will begin to believe that the rally will continue up to the February high. Even if that will happen, the 2 month bear trend will probably convert into a trading range for many months first. The bulls have to stop the bears before they can begin a bull trend. A bear trend typically has to transition into a trading range before it will evolve into a bull trend. That is what is likely over the next several months.
Weekly buy signal
I said on Friday and wrote over the weekend that last week was a big bull trend reversal bar on the weekly chart. The weekly chart has a wedge bull flag. However, I mentioned 2 problems. First, the selloff from the September 24 high is in a tight bear channel. Typically, the 1st leg up will have a pullback within the 1st few bars. Therefore, there will probably be sellers around the November 7 lower high on the daily chart. That is also around the 20 week EMA.
The 2nd problem with last week’s buy signal bar is that it is too big. A big buy signal bar means the stop is far below and the risk is therefore big. Many bulls will not take the buy signal. Instead, they will wait to buy a pullback that would allow them to use a tighter stop. This lack of bulls willing to buy around last week’s high makes a pullback likely this week.
Overnight EURUSD Forex trading
The EURUSD 5 minute Forex chart rallied 45 pips overnight. However, the bars were small, had prominent tails, and mostly overlapped one another. This is a weak rally and it will therefore probably lead to a trading range today. This is particularly true after an unusually protracted 5 day rally.
Summary of today’s S&P Emini futures price action and what to expect tomorrow
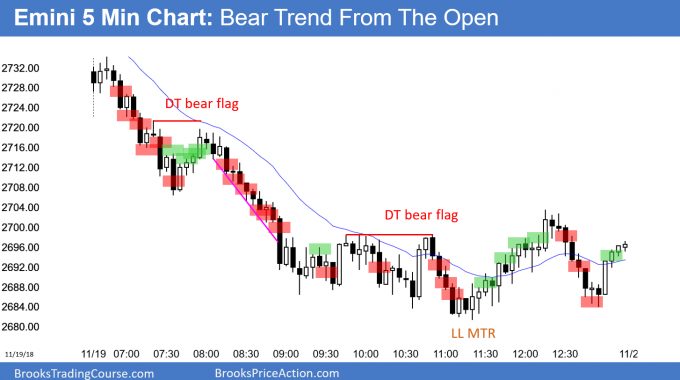
Here are several reasonable stop entry setups for today. I show each buy entry with a green rectangle and each sell entry with a red rectangle. I rarely also show limit order entries and entries on the close of bars. My goal with these charts is to present an Always In perspective. If a trader was trying to be Always In or nearly Always In a position all day, and he was not currently in the market, these entries would be logical times for him to enter.
Today triggered a Low 1 sell signal by trading below Friday’s low. Since Friday was a bull trend bar on the daily chart, it was a weak sell signal bar. However, today was a strong entry bar for the bears. If they get strong follow-through selling tomorrow, they will probably get a test of the October low. More likely, there will be buyers around today’s low and last year’s close.
See the weekly update for a discussion of the price action on the weekly candlestick chart and for what to expect going into next week.
Trading Room
Traders can see the end of the day bar-by-bar price action report by signing up for free at BrooksPriceAction.com. I talk about the detailed S&P Emini futures price action real-time throughout the day in the BrooksPriceAction.com trading room. We offer a 2 day free trial.
Charts use Pacific Standard Time
When I mention time, it is USA Pacific Standard Time (the Emini day session opens at 6:30 am PST, and closes at 1:15 pm PST). You can read background information on the intraday market reports on the Intraday Market Update page.


Hi Al, if you take a look at today’s SPY candle chart on http://www.barchart.com (link here: https://www.barchart.com/etfs-funds/quotes/SPY/technical-chart?plot=CANDLE&volume=total&data=I:5&density=L&pricesOn=1&asPctChange=0&logscale=0&im=5&sym=SPY&grid=1&height=500&studyheight=100), bar #40 has a big tail at bottom, the tail also exists on TradingView and InterativeBroker SPY chart, but the ES chart doesn’t have this tail, pretty sure I have seen this happened quite a few times, can you explain why this happens?
You are correct. While the SPY and the ES are closely arbitraged, the match is not perfect. There will rarely be a single relatively big trade that moves the SPY unusually far, like in your example, but the SPY quickly snaps back on the next trade. The computers do not have to create a similar move in the ES. This was much more common 20 – 30 years ago. Since most of the trading is now automated, it is currently rare. But, it still happens.
Al- Why wasn’t bar 46 a buy? I believe you took it for a point. I took it for 2 points, which I didn’t get, so I sold below 47. But I saw it as a 2nd entry reversal bar closing near its high below the middle of the TR.
I thought that the Bear Trend From The Open would be going sideways to a little down for at least a couple of hours because that is what typically happens. I was willing to add on lower, but without that, the math was not good enough for a scalp or a swing. Two bear bars, one surprisingly big, then a bull bar with a big tail, and finally a doji buy signal bar. That looks like a trading range and a weak buy, unless a trader was willing to use a wide stop and scale in.
I debated whether to hold for 2 points, and I was lucky when I took 1, and then it turned down quickly.