Emini High 1 bull flag but at triple top
I will update again at the end of the day.
Pre-Open market analysis
Today is the final day of the month. On the monthly chart, February will probably be a bull trend bar closing near its high.
On the daily chart, every pullback for the past 2 months lasted only 1 – 2 days. Yesterday was the 2nd day of a pullback. It is therefore a High 1 bull flag and a buy signal bar for today.
However, Monday was a strong sell signal bar. In addition, the daily chart is in a parabolic wedge buy climax at resistance. There is a triple top just above 2800 and Monday reversed down from above the 3rd top.
Because the buy climax on the weekly chart is so unusually extreme, the bulls will probably begin to take profits for 2 – 3 weeks. That profit-taking may have started on Monday. Therefore, while yesterday is a buy signal bar, there might be more sellers than buyers above its high and above Monday’s high.
The bulls want a 10th consecutive bull bar on the weekly chart. Monday’s selloff never came back to test the open of week at 2808.00. Consequently, the bulls will try to test it today or tomorrow.
Overnight Emini Globex trading
The Emini is down 4 points in the Globex session. Yesterday was a good buy signal bar in a bull trend on the daily chart. The Emini today will probably have to go above yesterday’s high to trigger the buy signal. Traders want to know if the bulls will be willing to buy in a buy climax at the top of the 4 month range.
Also, the bears want to see if they can turn the bulls back down a 2nd time. If they can, that would create a micro double top and increase the likelihood of a 2 -3 week pullback.
Yesterday’s high is an important magnet. And so is the open of the week at 2808.00. Therefore, the odds favor a test of 2808.00 today or tomorrow. The bulls will therefore buy pullbacks.
Because the bears expect a test of 2808.00 as well, there is not a strong reason to sell below there. But, they probably will sell there to make the week have a bear body when the week closes tomorrow.
Can today be a huge bull day that breaks far above Monday’s high? Or, can today reverse down to far below yesterday’s low? Neither is likely. The odds favor a test of 2808 today or tomorrow. Most of the trading for more than a week has been predominantly sideways. That is likely again today.
Yesterday’s setups

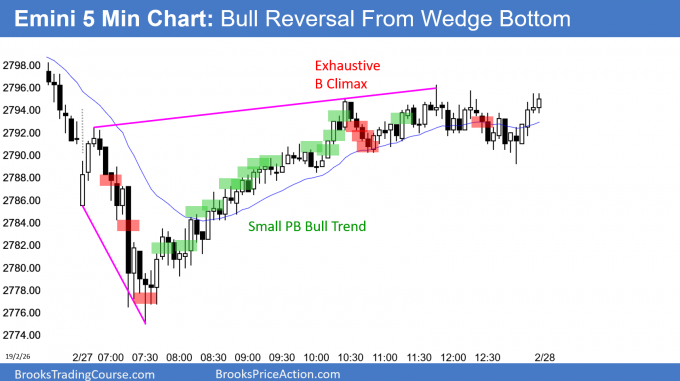
Here are several reasonable stop entry setups from yesterday. I show each buy entry with a green rectangle and each sell entry with a red rectangle. I rarely also show limit order entries and entries on the close of bars. My goal with these charts is to present an Always In perspective. If a trader was trying to be Always In or nearly Always In a position all day, and he was not currently in the market, these entries would be logical times for him to enter.
EURUSD wedge rally to middle of 4 month trading range

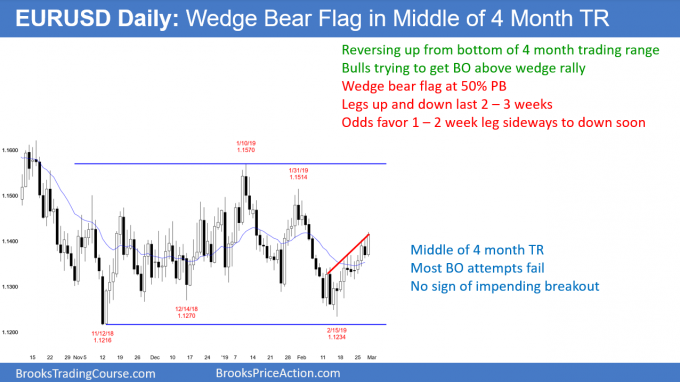
The EURUSD daily Forex chart rallied back to the middle of its 4 month range. The rally has had 3 to 4 pushes up and is therefore a wedge. A wedge rally is a buy climax. Buy climaxes typically result in exhausted bulls. They usually lead to a pause. Consequently, the odds favor a few sideways days. This is especially true since trading range markets spend most of their time in the middle third of the range.
The bulls want today to close on its high and far above yesterday’s high. They then want tomorrow to also be a bull day. If they get that, today’s breakout above the wedge bear flag will probably continue up to the top of the 4 month range.
More likely, the rally will stall today or tomorrow and the chart will go sideways for several days. Look back over the past 4 months. Most of the trading was between 1.13 and 1.15. This is where the market currently is.
Trading ranges always have strong legs up and down. But, reversals are more likely than successful breakouts. I said this during the early February collapse, even though the selloff was strong. I also said that at the January high. Nothing has changed. There is no breakout until there is a breakout. Until then, traders correctly expect reversal every 2 – 3 weeks.
Overnight EURUSD Forex trading
The EURUSD 5 minute Forex chart rallied 50 pips overnight. However, it pulled back 30 pips over the past hour. The bulls want a close today far above yesterday’s high, but that is unlikely.
Yesterday had a bear body on the daily chart. The rally is in a wedge bull channel. And, the market is back to the middle of its 4 month range. Consequently, there will be probably more sellers than buys above yesterday’s high. Day traders will look to sell rallies to around yesterday’s high.
Since the 3 week rally has been strong, a big bear day is unlikely. Consequently, the bulls will buy a 30 – 50 pip pullback. The result will probably be a trading range day.
Furthermore, the 5 minute chart will probably enter a trading range between 1.13 and 1.14 for a few days. That is because there was a pause for 3 days last week around 1.13, and channels typically evolve into trading ranges.
Summary of today’s S&P Emini futures price action and what to expect tomorrow

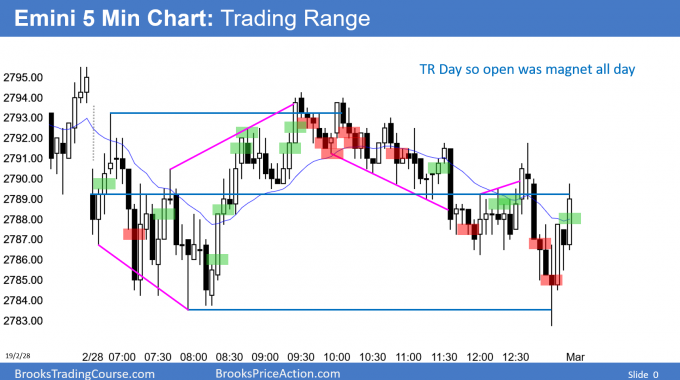
Here are several reasonable stop entry setups for today. I show each buy entry with a green rectangle and each sell entry with a red rectangle. I rarely also show limit order entries and entries on the close of bars. My goal with these charts is to present an Always In perspective. If a trader was trying to be Always In or nearly Always In a position all day, and he was not currently in the market, these entries would be logical times for him to enter.
End of day summary
Today was the last day of the month, and February closed near its high. The weekly chart is more important. The bulls have a streak of 9 consecutive bull bars on the weekly chart. I only found one longer streak in the 20+ year history of the Emini. Consequently, the odds favor a close below 2808.00 tomorrow. However, it is a magnet, and the bulls will try to test it tomorrow. It is probably too far above for the bulls to get there tomorrow.
Monday’s bear reversal is probably the start of a 2 – 3 week pullback. This is true even if next week goes slightly above this week’s high.
See the weekly update for a discussion of the price action on the weekly chart and for what to expect going into next week.
Trading Room
Traders can see the end of the day bar-by-bar price action report by signing up for free at BrooksPriceAction.com. I talk about the detailed S&P Emini futures price action real-time throughout the day in the BrooksPriceAction.com trading room. We offer a 2 day free trial.
Charts use Pacific Standard Time
When I mention time, it is USA Pacific Standard Time (the Emini day session opens at 6:30 am PST, and closes at 1:15 pm PST). You can read background information on the intraday market reports on the Intraday Market Update page.
Hi Al,
if there was one thing which would need to be different to make you question the particular example above as a Final Bear Flag reversal with a good buy signal bar, what would it be?
Would it be missing that little pause bull bar during 2nd leg down?
thx
Al. got another question, if you don’t mind. If Euro plunges to yesterday’s low like this and immediately fails with a reversal bar.
Would you buy that bar straight away or wait for more? I thought it was so strong down so I waited for a micro-db or second signal but it just took off without me! I guess what I’m asking is: If the signal bar is a failure at important S/R like a prior day high/low is it ok to take it immediately regardless of the strength down without waiting for a second signal or always in long? (By the way the time on the chart is GMT.)
Thanks for your time and support.
That particular example is a Final Bear Flag reversal with a good buy signal bar. I like that setup and I think it is a good buy above the high of the buy signal bar.
Hi Al. Was just wondering are you still targeting 10 pip scalps on EURUSD on the 5m chart with stop entries with the low volatility we have lately? I am finding that 5 pips scalps gives me just under 1:1 R/R with the average bar sizes; and that the target almost always hits for 5 pips.
I think the math is bad for 5 pip scalps. I talk about it in the course. A trader typically has to give up about a pip on every trade. Therefore, every loser is at least 7 pips, but the winners are only 5 pips. He has to be right at least 80% of the time for this to be worthwhile. In addition, he has to be flawless. That includes physically flawless, like clicking his mouse correctly and placing the orders accurately and quickly. These factors make it very difficult to make a living off 5 pip scalps. While it is theoretically reasonable, it is almost impossible to do profitably long-term.
Well its actually Euro Futures I’m trading. Where 5 pips is equal to 10 Ticks for a $62 reward. Does that change things? It seems similar to an E-mini scalp.
Hi Kevin
I trade currency futures as well. I assume that your ten tic profit of $62 attracts a commission of $12 leaving you with a net profit of $50. I have been quilty of this type of trading and it means that your win loss ratio has to be high or commissions will eat you alive.
Cheers
Michelle
I think the math gets bad if the commission (or spread, if Forex) gets much above 10% of the minimum profit. For example, if the commission is $12, and the scalp is $62, each win is $50 and each loss is $74. If you make some room for mistakes and unanticipated problems, a trader would have to win at least 80% of the time long-term for it to be a profitable strategy. I have known many traders who win 80% of the time, but they are rare. I personally would rather trade with better math. Trading has to be fun as well as profitable, and that is too much stress for most people.
Hi Al
Thanks for the reply and thank you for a fabulous course. I am learning so much.
What you have said is spot on. Thats why I try to swing trade more than scalp and try to take as much money out of the trade as the market will let me.
I have just finished watching the videos on measured moves.
Cheers
Michelle