Emini and Forex Trading Update:
Thursday July 9, 2020
I will update again at the end of the day.
Pre-Open market analysis
The Emini had swings up and down yesterday after Tuesday’s strong bear trend. It was therefore a trading range day.
But after a midday higher low major trend reversal, it closed near its high. I have been saying for several days that the best the bears would probably get this week was a 1 – 2 day pullback. Yesterday is a good candidate for the end of that pullback. It closed back at the open of the week.
Even though the Emini is still in its 6 week trading range, this week triggered a buy signal on the weekly chart. Yesterday is now a High 1 bull flag buy signal bar for today. Traders expect higher prices.
Overnight Emini Globex trading
The Emini is up 6 points in the Globex session. It is near the high of last week and the open of this week.
Both prices will be important when the candlestick on the weekly chart closes tomorrow. The bulls want at least a small bull body on the weekly candlestick. That means they want tomorrow to close above this week’s open. That would also be a close above last week’s high. Traders would then expect higher prices next week.
However, if the week closes below the open and below last week’s high, there would be a micro double top with Monday’s high. Traders would then look for a reversal down next week.
The daily and weekly charts are both in bull trends. Consequently, traders expect higher prices. But the Emini might stay around the open of the week today and then decide at the end of tomorrow if the week will have a bull or bear body on the weekly chart.
Because yesterday is a buy signal bar in a bull trend, there is an increased chance of a bull trend. However, the Emini is also near the top of a month-long trading range. Therefore, the bulls have only a slight advantage.
Yesterday’s setups

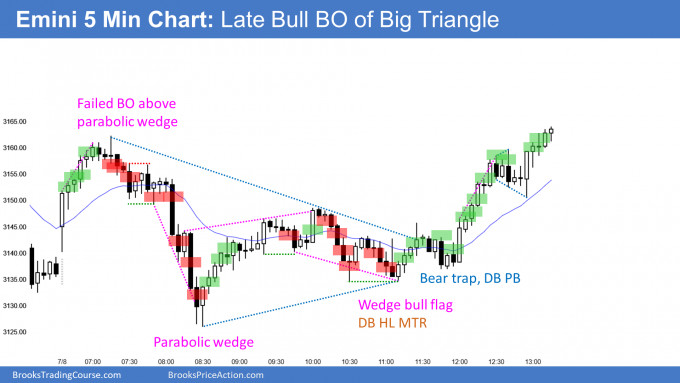
Here are several reasonable stop entry setups from yesterday. I show each buy entry with a green rectangle and each sell entry with a red rectangle. I rarely also show limit order entries and entries on the close of bars. I do not want the lines to be distracting. If they are longer, I make them dotted. But, they have to be visible, so I make the shorter ones solid. Buyers of the Brooks Trading Course and Encyclopedia of Chart Patterns have access to a much more detailed explanation of the swing trades for each day (see Online Course/BTC Daily Setups).
My goal with these charts is to present an Always In perspective. If a trader was trying to be Always In or nearly Always In a position all day, and he was not currently in the market, these entries would be logical times for him to enter.
If the risk is too big for your account, you should wait for trades with less risk or trade an alternative market like the Micro Emini.
EURUSD Forex market trading strategies

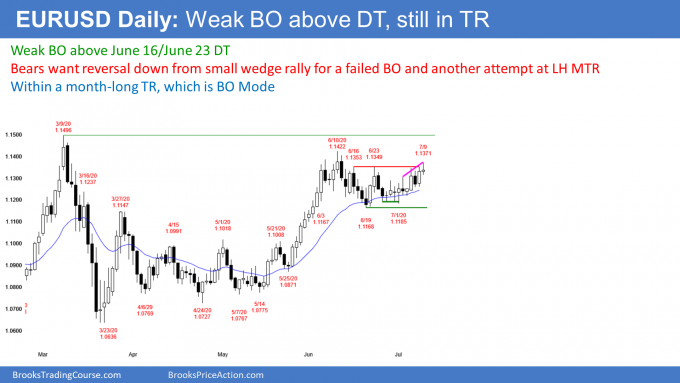
The EURUSD Forex market on the daily chart has rallied for a couple weeks, but it is still in a month-long trading range. So far, today is a doji bar on the daily chart, and its close is below the June 16/June 23 double top.
This is a weak breakout. The bulls want today to close above the double top and on the high of the bar. Furthermore, they want today to have a big range.
It does not look like they will achieve their goals. At a minimum, they want today to close above the open so that it will have at least a small bull body.
Because the EURUSD is now near the top of the trading range, the bulls are starting to take profits and the bears are beginning to sell. If enough traders sell up here, there will be a reversal down instead of a breakout above the June high.
When a market is in a trading range, reversals are move common than breakouts. The bears are hoping that today will be the start of a bear leg. They see the 2 week rally as forming a wedge, which often is a reversal pattern.
They want today to close near its low. It would then be a reasonable sell signal bar for tomorrow. The bears would have a wedge rally and another attempt at a lower high major trend reversal down from the 2 year bear trend line (not shown).
Overnight EURUSD Forex trading
The 5 minute chart of the EURUSD Forex market rallied to above the June 16/June 23 double top today, but reversed down to a new low of the day. It has since bounced to back above the open of the day.
There have been 2 legs up and one leg down. So far, today is a trading range day and it is trading around the open of the day and the June double top. Traders are deciding if the breakout on the daily chart will fail or succeed.
With the EURUSD oscillating around the magnets of the open and the double top, there is confusion. Confusion typically results in a trading range. Consequently, day traders are expecting a trading range and reversals for the rest of the day. They therefore are scalping.
Because the EURUSD is at an important price, there is an increased chance of a surprise up or down. But with the lack of consecutive big trend bars in either direction, it is more likely that today will remain a trading range day. It will probably close near the open and not provide much information about what to expect tomorrow.
Summary of today’s S&P Emini futures price action and what to expect tomorrow

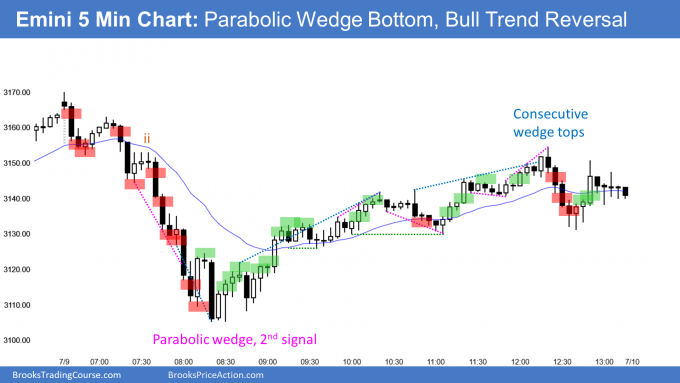
Here are several reasonable stop entry setups for today. I show each buy entry with a green rectangle and each sell entry with a red rectangle. I rarely also show limit order entries and entries on the close of bars. I do not want the lines to be distracting. If they are longer, I make them dotted. But, they have to be visible, so I make the shorter ones solid. Buyers of the Brooks Trading Course and Encyclopedia of Chart Patterns have access to a much more detailed explanation of the swing trades for each day (see Online Course/BTC Daily Setups).
My goal with these charts is to present an Always In perspective. If a trader was trying to be Always In or nearly Always In a position all day, and he was not currently in the market, these entries would be logical times for him to enter.
If the risk is too big for your account, you should wait for trades with less risk or trade an alternative market like the Micro Emini.
End of day summary
The Emini sold off from above yesterday’s high to below yesterday’s low, becoming an outside down day. However, it reversed up to the middle of the range.
It is still near enough to the high of last week and the open of this week to reach these magnets tomorrow. Tomorrow is Friday so those weekly magnets can be important, especially at the end of the day.
The daily chart has been in a tight trading range at the top of a 6 week trading range. Traders are deciding whether the rally will continue up to the old high or reverse down to the middle of the 3 year range. Because the daily and weekly charts are in bull trends, the probability slightly favors a bull breakout of the 6 week range.
See the weekly update for a discussion of the price action on the weekly chart and for what to expect going into next week.
Trading Room
Traders can see the end of the day bar-by-bar price action report by signing up for free at BrooksPriceAction.com. I talk about the detailed S&P Emini futures price action real-time throughout the day in the BrooksPriceAction.com trading room. We offer a 2 day free trial.
Charts use Pacific Standard Time
When I mention time, it is USA Pacific Standard Time (the Emini day session opens at 6:30 am PST, and closes at 1:15 pm PST). You can read background information on the intraday market reports on the Market Update page.
Hi Al,
I bought today’s e-mini MTR from the parabolic wedge back up for a nice profit up, however i set my profit target at about 50% reversal back up from the range which was about 3,138, and while it stalled in that area for a bit, it ended up going much higher for another 12 points of profit till 3,150. My question is how can one better see if it’s time to exit at around a 50% reversal versus staying in to get more profit?
Hi Herman,
Al is taking a break so let me comment. If you had already set a target at 50% you should really be following your rules, getting out, and then wait for next setup. That came on a High 2 at end of pullback. You would then have made more money compared to staying in market and risking a surprise bear bar, for example.
If you did decide to stay in, you would have recognized the Small Pullback Bull Trend, so getting out below a bear bar would have worked fine, albeit a little less profit if your target had been above.
There really is no way that we can know what will happen next for certain, so again, follow your rules and take it from there.
Hope this helps. Maybe others can comment too?
Thank you! This makes sense.
For me, I take partial profits at a 50% retrace. If I get 2 reasons to exit all, I do and get back in above a buy signal if the AID has not changed. Yesterday at bar 51 there where 3 reasons… a wedge rally, micro DT and a good looking bear outside down sell signal on 51. Good enough to exit all, but 51 closed above the EMA so if it does not change to AIS, look to buy again above a good bull signal bar (54). I didn’t think the PB from 47 to 53 was enough to change it to AIS. Also 53 was an ema gap bar.
Al, since AAPL and AMZN are part of SPX and is driving the E-mini prices up, how do you see their charts?
Both of these are surely climatic and parabolic.. and I just can’t see how it can go up continuously in a vertical fashion..
Hi Andrew,
Al is taking a few days break but even so, he does not usually have time to comment on other markets except when raised in his trading room. (We will have a post on Tesla tomorrow, for example.)
You are right to suspect AAPL and AMZN are not going to keep rising so much, especially given the pandemic that is not being addressed well in the US. Caution is called for in my humble view. Others may think different and look forward to any other traders commenting on this here.
Hey Admin (I never got your name.. my sincere apologies..)
Thank you very much for your input..
Yeah.. it seems like that’s climatic and the US response to the pandemic has been problematic.
Alright looking forward to the TSLA report tomorrow.
Stay safe!
Al does also talk about AAPL and AMZN during the upcoming Ask Al post due tomorrow. Hope it helps.
AAPL I see a parabolic wedge. Amazon is certainly climatic.
As far as the Emini on the daily, it looks like we could form a ioi pattern with the 3rd bar being bullish and coming off of the moving average in a daily and weekly bull trend. If it were above the June high I would say up up up, but seems like its been having trouble, so far breaking up. I’m sure Al would say slightly bullish haha.
Thanks Al!