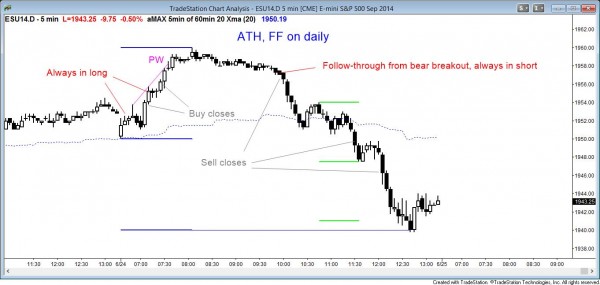
Posted after the close, but this is from the discussion in the chat room today.

Today had a parabolic wedge top and trend reversal after an early rally off the 60 min 20 bar exponential moving average. The Emini became always in long on the second bar and then rallied strongly up to a parabolic wedge top, then a small pullback bear trend that had a bear breakout at 9:50 am and follow-through over the next two bars, reversing the trend to always in short. It was a sell the close market, and bounced at the measured move target. There might be more selling early tomorrow, but consecutive sell climaxes in a tight channel usually is followed by a major trend reversal bottom on the next day. Tomorrow has a 2/3 chance of at least 2 legs sideways to up for at least 20 bars. There is a 1/3 chance of a strong bear day and a bigger move down, especially because of the daily and weekly charts.
On the daily chart, today’s outside down reversal was a second entry short trade as today fell below yesterday’s low. The first entry for the final flag top was yesterday when it fell below the low of the day before. The S&P cash index and the Emini are both turning down from the top of a weekly bull channel at measured move targets on the weekly and 60 minute charts. If the bear breakout continues, the downside target is the bottom of the weekly channel. There are several bull trend lines below, and each is a target.
Traders can see the end of the day bar-by-bar report by signing up for free at BrooksPriceAction.com. I talk about the detailed Emini price action real-time throughout the day in the BrooksPriceAction.com trading room, and a 2 day free trial is available.
I sometimes refer to bar numbers (there are 81 five minute bars each day) instead of times on the 5 minute. When I mention time, it is USA Pacific Standard time (the market opens at 6:30 am PST, and closes at 1:15 pm PST). Background information on this report can be read on the Intraday Market Update page.