Emini and Forex Trading Update:
Wednesday November 20, 2019
I will update again at the end of the day.
Pre-Open market analysis
After 7 consecutive bull bars on the daily chart, the Emini finally had a bear bar yesterday. However, a strong bull trend does not typically immediately reverse into a bear trend. Most traders want to see at least a small double top.
The bulls have been so eager to buy that they have been buying above the prior day’s low for 4 days. Many will be happy to finally get an opportunity to buy below a prior day’s low. As a result, there will probably be buyers not far below yesterday’s low.
There are also 6 consecutive bull bars on the weekly chart. In addition, last week’s range increased and therefore will probably attract some profit takers. Therefore, this week will probably close below its open or at least near its open. A doji bar is common after a buy climax bar.
The open will likely be a magnet all week. Since a big bear bar is unlikely, the bear body will probably be small. That means the week will probably close only a little below the week’s open. This will probably lead to mostly sideways trading around the open of the week for the remainder of the week.
Overnight Emini Globex trading
The Emini is down 8 points in the Globex session. It might gap below yesterday’s low. If so, the gap will be small. Small gaps usually close in the 1st hour. Since the daily chart is in a Small Pullback Bull Trend, traders expect the pullback to last for 1 – 3 days.
However, the weekly chart will probably form a doji bar this week after last week’s bigger bar. Consequently, the Emini might stay around the open of the week for the remainder of the week. That increases the chance of trading range price action for the rest of the week.
Because the bull trend on the daily chart is strong, traders always have to be ready for a surprisingly big bull day. But the daily and weekly charts are in buy climaxes at the top of the weekly bull channel. Consequently, there is a slightly increased chance of a big bear day soon. But the bears will probably need a micro double top first. Most likely, the Emini will be sideways for a few days.
Yesterday’s setups

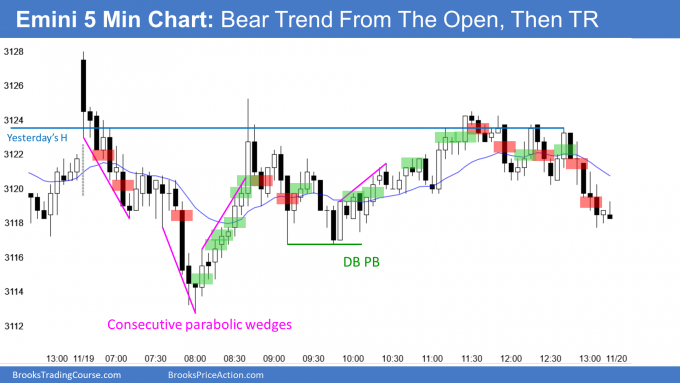
Here are several reasonable stop entry setups from yesterday. I show each buy entry with a green rectangle and each sell entry with a red rectangle. I rarely also show limit order entries and entries on the close of bars. Buyers of the Brooks Trading Course and Encyclopedia of Chart Patterns have access to a much more detailed explanation of the swing trades for each day.
My goal with these charts is to present an Always In perspective. If a trader was trying to be Always In or nearly Always In a position all day, and he was not currently in the market, these entries would be logical times for him to enter.
EURUSD Forex market trading strategies

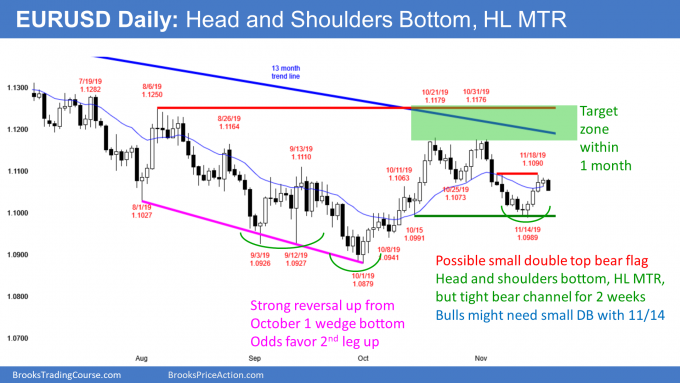
The daily chart of the EURUSD Forex market is reversing up from a higher low major trend reversal. Since the 2 week selloff was in a tight bear channel, the 4 day rally will probably be minor. That means that traders expect a test down for a few days before there is a test of the October high.
The appearance of this week is important on the weekly chart. Last week was a good buy signal bar for a High 2 bull flag and head and shoulders bottom. This week is the entry bar. If the bulls can create a big bull bar this week, it will erase the bearishness of the bar from 2 weeks ago.
But so far, this week has a small range. That hesitation reduces the chance of the rally continuing up next week. It makes several sideways days more likely.
Furthermore, 2 weeks ago was a Bear Surprise Bar on the weekly chart. That typically has at least a small 2nd leg sideways to down. The inability of the bulls to rally strongly this week makes some sideways to down trading likely next week.
Overnight EURUSD Forex trading
The 5 minute chart of the EURUSD Forex market sold off overnight in a weak bear channel. Traders are deciding if the weekly chart will get a 2nd leg down after the big week down 2 weeks ago. The other possibility is that the the bulls will get a 2nd leg up on the daily chart after 4 consecutive bull bars on the daily chart.
The EURUSD is also in the middle of the month-long trading range, which is in a 4 month trading range. Traders expect disappointing follow-through up and down. That means reversals. It also means lots of trading range price action on the 5 minute chart.
After 4 bull days on the daily chart, there will probably be buyers below yesterday’s low. That should limit the downside today. However, the bulls have been unable to create a good entry bar on the weekly chart after 3 days. That means the upside also is probably be small. What’s left? Mostly trading range trading. Day traders will look for reversals to scalp for 10 pips.
Summary of today’s S&P Emini futures price action and what to expect tomorrow

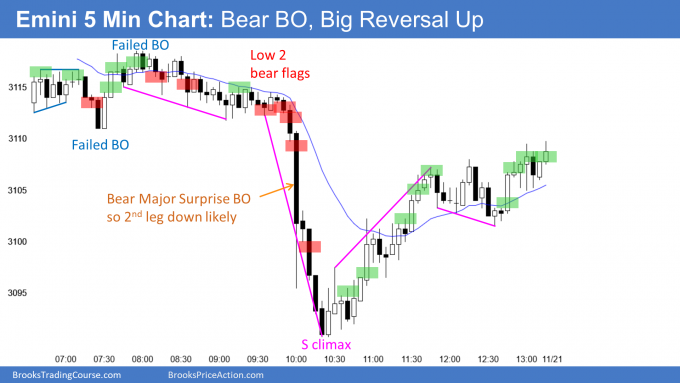
Here are several reasonable stop entry setups for today. I show each buy entry with a green rectangle and each sell entry with a red rectangle. I rarely also show limit order entries and entries on the close of bars. Buyers of the Brooks Trading Course and Encyclopedia of Chart Patterns have access to a much more detailed explanation of the swing trades for each day.
My goal with these charts is to present an Always In perspective. If a trader was trying to be Always In or nearly Always In a position all day, and he was not currently in the market, these entries would be logical times for him to enter.
End of day summary
The Emini was in a tight trading range for 3 hours and then collapsed. It fell below the 3100 Big Round Number and the 6 week bull trend line. But it reversed back above the midpoint and today was a doji bar on the daily chart.
This is a credible start for the 1 – 2 week, 50 – 100 point pullback that I said was likely to begin in November. However, the big reversal back up increases the uncertainty. That therefore increases the chance of sideways price action for a day or two.
Even if there is a 2 week selloff that falls 100 points, after 6 bull bars on the weekly chart, traders will probably buy the pullback.
Since today was a major Bear Surprise Breakout on the 5 minute chart, there will probably some follow-through selling over the next few days. This is true even if the Emini gets back to the open of the week first.
See the weekly update for a discussion of the price action on the weekly chart and for what to expect going into next week.
Trading Room
Traders can see the end of the day bar-by-bar price action report by signing up for free at BrooksPriceAction.com. I talk about the detailed S&P Emini futures price action real-time throughout the day in the BrooksPriceAction.com trading room. We offer a 2 day free trial.
Charts use Pacific Standard Time
When I mention time, it is USA Pacific Standard Time (the Emini day session opens at 6:30 am PST, and closes at 1:15 pm PST). You can read background information on the intraday market reports on the Market Update page.