Emini minor sell signal in middle of October trading range
I will update again at the end of the day.
Pre-Open market analysis
Friday was an inside day on the daily chart and last week was an inside bar on the weekly chart. By trading below Friday’s low, the bears triggered a minor sell signal on the daily chart yesterday. The bulls still might get one more leg up on the daily chart before the Emini gets a 2nd leg down to the close of 2017.
Because the October selloff is probably a sell vacuum test of last year’s close, the Emini will probably have to fall below 2689.75 within the next few weeks. It will probably gap down big today, which would trigger the minor weekly sell signal. It therefore might then get to the target within a week or two, and possibly today.
Since the Emini has been in a trading range for 8 days, traders are being quick to take profits. This creates reversals every few days. The bulls want a reversal up from the low of 2 weeks ago. However, as I have been saying, this selloff probably cannot escape the magnetic pull of the close of 2017. Therefore, any reversal up before reaching that target will probably be minor.
Overnight Emini Globex trading
The Emini is down 38 points in the Globex session. A big gap down increases the chance of a trend day. If there is a trend, a bear trend is more likely. This is especially true because of the important magnetic pull of the 2017 close. It is now only about 20 points below the Globex low.
The bulls want a double bottom with the low of 2 weeks ago. If the Emini falls to the 2017 close, the bulls will want a reversal up from there. The bears want a strong break below those support levels and a test of the February low.
Traders should find out over the next 2 weeks which is more likely. If the bulls get a series of bull trend days, then the support will hold. If instead the bears get a couple big bear days closing on their lows, the Emini will probably fall further. The next support is the May low and then the February low.
In either case, there is an increased chance of a trend day. In addition, the daily ranges will continue to be big. Therefore, even trading range days will have big swings.
Yesterday’s setups
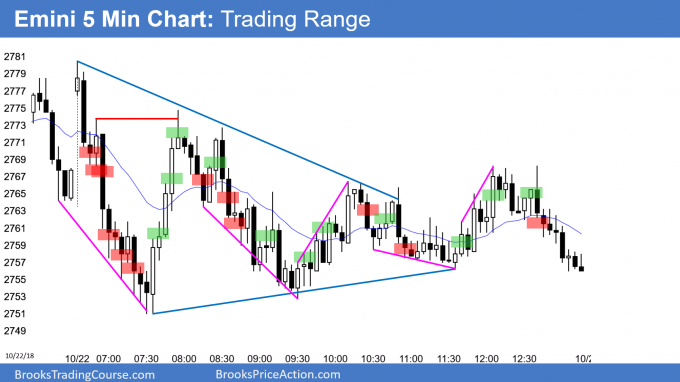
Here are several reasonable stop entry setups from yesterday. I show each buy entry with a green rectangle and each sell entry with a red rectangle. I rarely also show limit order entries and entries on the close of bars. My goal with these charts is to present an Always In perspective. If a trader was trying to be Always In or nearly Always In a position all day, and he was not currently in the market, these entries would be logical times for him to enter.
EURUSD Forex double bottom and micro double bottom
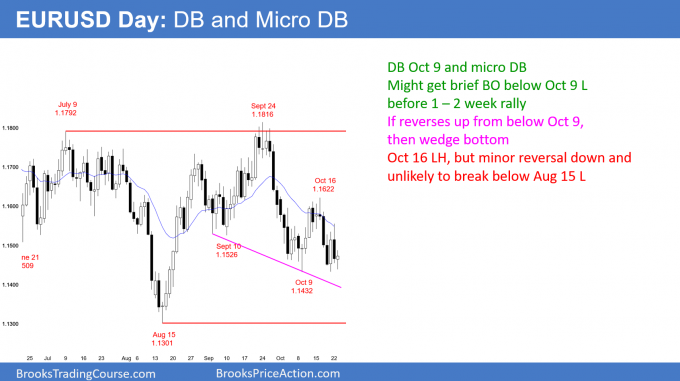
The EURUSD daily Forex chart still has a double bottom with the October 9 low. It is now trying to create a micro double bottom with Friday’s low.
The 6 day selloff from the October 16 lower high will probably form a higher low. The bulls are looking for a bottom. I said that they would probably need a micro double bottom because last week had 2 big bear days. If today closes near its high and has a average size body, today would be a credible buy signal bar on the daily chart. There would be a double bottom with the October 9 low and a micro double bottom with Friday’s low.
Alternatively, if today only has a small bull body or a bear body, then the daily chart will probably fall below last week’s low. If it does, the bear breakout will probably last only 1 – 3 days. A reversal up at that point would create a wedge higher low major trend reversal. The 1st 2 points in the wedge are the September 10 and the October 9 lows.
Until there is a strong reversal up, the bears still have a 40% chance of a break below the August 15 low. But, the month long selloff might get almost all of the way down to that low before the bulls take control.
Even when the bulls get their rally, it will probably only last a few weeks. This is because the daily chart is in a 6 month trading range. Every leg up or down, no matter how strong, has reversed within a few weeks.
Overnight EURUSD Forex trading
The EURUSD 5 minute Forex chart reversed up 50 pips overnight. However, the rally has had deep pullbacks and many big bear bars. This is not how a swing up on the daily chart typically begins. Day traders are still taking quick profits on longs and they are selling rallies. This usually results in a trading range day.
Because of the possible bottom on the daily chart, there is an increased chance of a trend day up or down. At the moment, the odds favor a continuation of the overnight trading range price action.
Summary of today’s S&P Emini futures price action and what to expect tomorrow
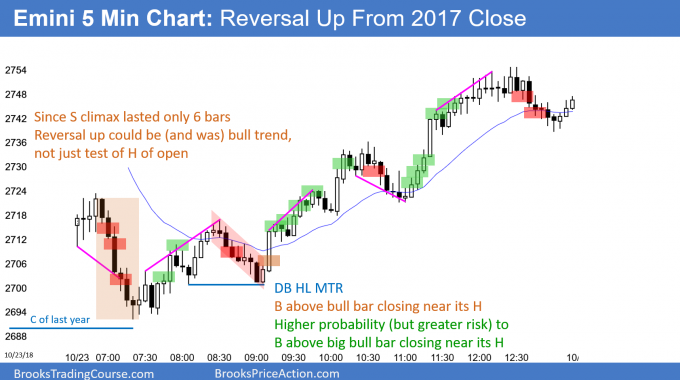
Here are several reasonable stop entry setups for today. I show each buy entry with a green rectangle and each sell entry with a red rectangle. I rarely also show limit order entries and entries on the close of bars. My goal with these charts is to present an Always In perspective. If a trader was trying to be Always In or nearly Always In a position all day, and he was not currently in the market, these entries would be logical times for him to enter.
This is a very good day and an important day for the bulls. It is a credible possible low for the rest of the year.
The Emini had a big gap down, but reversed up from 2.5 points above the close of 2017. Traders are therefore deciding if this 2nd leg down from the selloff of 2 weeks ago has ended. Will the Emini rally into the end of the year, or does the selloff have to fall below last year’s close?
Since the 2017 close on the cash index is about 10 points below today’s low, it might not have been adequately tested. But, today is a good buy signal bar for tomorrow. If there is a big bull trend day tomorrow and again on Thursday, then this will probably be the low for the rest of the year. Without a strong reversal up this week, the odds will favor at least slightly lower prices.
See the weekly update for a discussion of the price action on the weekly candlestick chart and for what to expect going into next week.
Trading Room
Traders can see the end of the day bar-by-bar price action report by signing up for free at BrooksPriceAction.com. I talk about the detailed S&P Emini futures price action real-time throughout the day in the BrooksPriceAction.com trading room. We offer a 2 day free trial.
Charts use Pacific Standard Time
When I mention time, it is USA Pacific Standard Time (the Emini day session opens at 6:30 am PST, and closes at 1:15 pm PST). You can read background information on the intraday market reports on the Intraday Market Update page.


Would you consider this type of market behavior (wild swings/extreme volatility/large wicks) common during major sell-offs, or is it something relatively new with the many more retail traders in the market now?
Although every few years some pundit on TV will say that there is a new economy and a new stock market and the old rules don’t apply, he is a fool. I’ve been watching every tick for more than 30 years. If you take any 5 minute or daily chart today and from 30 or 100 years ago and hide the time and price, there is no difference.
How can that be? Because markets reflect rational behavior, and there have always been enough rational people in the markets to dominate them. That has always been the case. Retail traders like you and me make up only 5% of the trading volume and are insignificant, and always have been.
Big swings happen in selloffs, not at tops. Why is that? Because the stock market on the yearly chart has always been in a bull trend, even during the Great Depression. There are simply lots of people who will never sell, and they will quickly buy more during sharp selloffs. Also, the shorts take profits when they receive a gift (a sharp selloff). The result is that selloffs often have very big, fast reversals. Usually, the market needs 2 or more before the final bottom is in.
Within a couple of months, everyone who is upset by the big days will be complaining again about the small days. The market constantly probes in every way. Once it has done too much of one thing, everyone will look for more of the same. There will not be enough institutions betting the other way, and the price action will be forced to change. The market is currently exploring extreme volatility. It will soon explore extreme tight trading ranges, and anything else you can imagine.
Hi Al
when you said Friday is a ‘ minor sell signal ‘ ; did you mean that it will likely result in a bear leg in a TR; and not a bear trend? Thank you
Yes, it is a low probability bet for a bear trend. A doji inside bar typically has buyers not far below.