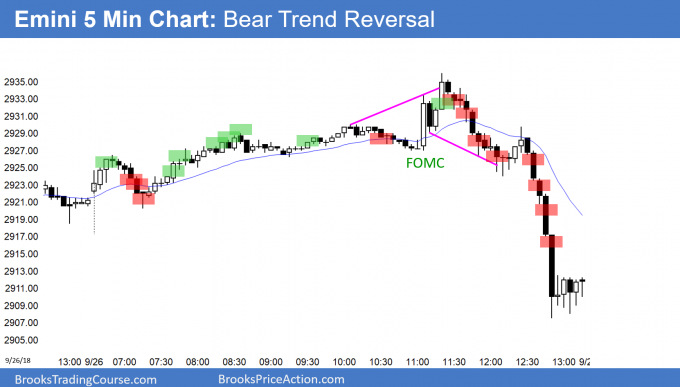
Emini outside down day after September FOMC announcement
I will update again at the end of the day.
Pre-Open market analysis
The Emini rallied briefly after the FOMC report but sold off from above Tuesday’s high to below Tuesday’s low. Yesterday was therefore an outside down day. The odds are that last Friday began a 2 – 3 week selloff down to support. The support is the bull trend line and the 20 week EMA.
If the bulls create a strong reversal up today or tomorrow, then they will have a chance at a new high before testing the 20 week EMA. For example, if today is a bull inside bar on the daily chart, it will form an ioi buy signal for Friday. But, the bulls still would need a strong reversal up to erase yesterday’s selling pressure.
The bears want the week to close near its low. That would create a sell signal bar on the weekly chart and make a test down to the 20 week EMA more likely. They will therefore sell rallies and try to get tomorrow’s close to be near the low of the week.
Overnight Emini Globex trading
The Emini is up 5 points in the Globex market. A big selloff like what happened yesterday is not as bearish as it appears. About 50% of it is related to the gamma of puts and option selling firms having to hedge. Since they got back to fully hedged by yesterday’s close, there is less chance of a big follow-through bear day today. After yesterday’s sell climax, there is a 75% chance of at least 2 hours of trading range trading beginning by the end of the 2nd hour. It often begins on the open.
Most big outside days are followed by inside days or days that fail to go much beyond the range of the outside day. If today opens above yesterday’s low, the bulls will try to keep today above yesterday’s low. If the bears break below yesterday’s low, the bulls will try to prevent a big selloff. Therefore, there will probably be sellers around yesterday’s low. Since today will probably open near yesterday’s low, there might be an early low of the day.
Yesterday might be the start of a swing down to the 20 week EMA. The bears will try to create another strong bear day. However, today will probably not gap down on the open. That means the bears were not as strong they could have been. This generates confusion, and confusion usually creates a trading range. Day traders do not believe that trends will last and they therefore bet on reversals.
Yesterday’s setups
Here are several reasonable stop entry setups from yesterday. I show each buy entry with a green rectangle and each sell entry with a red rectangle. I rarely also show limit order entries and entries on the close of bars. My goal with these charts is to present an Always In perspective. If a trader was trying to be Always In or nearly Always In a position all day, and he was not currently in the market, these entries would be logical times for him to enter.
EURUSD Forex market trading strategies
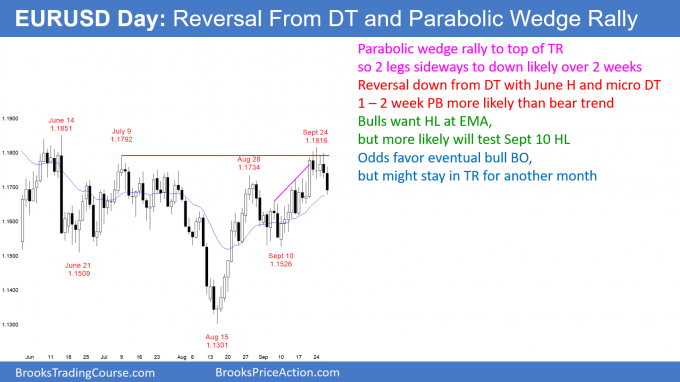
After rallying over the past month to the top of the 5 month trading range, the EURUSD daily Forex chart turned down last week. There was a micro double top, a double top, and a parabolic wedge buy climax.
I have been saying for the past week that the rally would probably end with the parabolic wedge buy climax. I also said that the odds favored about 10 days and 2 legs down. The typical target is the bottom of the parabolic wedge, which is the September 10 low just above 1.15.
A reversal from a parabolic wedge buy climax usually has at least 2 small legs. In addition, the 1st leg down usually ends in the middle of the wedge, which would be between 1.16 and 1.1650.
If the selloff reaches the target at around 1.15, it typically ends. The chart then enters a trading range. The bulls will want a double bottom with the September 10 low, and the bears want the double top with the July high to lead to a breakout below the August low.
The odds favor a trading range over the next several weeks. This selloff will probably continue down to around 1.16, but there will probably be a 2 – 3 day rally within a week.
Overnight EURUSD Forex trading
The EURUSD 5 minute Forex chart sold off 80 pips in 2 legs over night. The bears want the week to close near its low. That would create a sell signal bar on the weekly chart at the 20 week EMA.
The bulls want a rally back up above the open of the week. However, the bulls are running out of time. The odds are that day traders will sell rallies and the candlestick on the weekly chart will be a bear sell signal bar. The odds are against a strong bull day today.
While the 5 minute chart sold off overnight, the most of the selling was in 2 brief bear breakouts. The majority of the overnight trading was within tight trading ranges. That makes a big trend today unlikely.
Since the bears have already accomplished their goal of creating a possible good sell signal bar on the weekly chart, they do not need lower prices this week. They will therefore simply try to prevent a strong reversal back up. Consequently, the bears will sell any 30 – 50 pip rally today or tomorrow and try to keep the market near the low of the week.
With the bulls unable to get a strong reversal and the bears not needing a strong selloff, day traders will most likely scalp today.
Summary of today’s S&P Emini futures price action and what to expect tomorrow
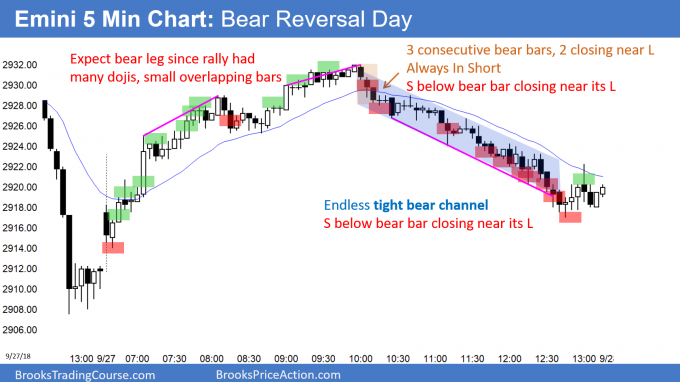
Here are several reasonable stop entry setups for today. I show each buy entry with a green rectangle and each sell entry with a red rectangle. I rarely also show limit order entries and entries on the close of bars. My goal with these charts is to present an Always In perspective. If a trader was trying to be Always In or nearly Always In a position all day, and he was not currently in the market, these entries would be logical times for him to enter.
The Emini rallied on the open, but then reversed back down to the open. Today was an inside day. After yesterday’s outside day, there is now an ioi Breakout Mode pattern on the daily chart. Because today’s range was fairly big, tomorrow could be a consecutive inside day.
Every day this week has oscillated around Monday’s open. Therefore traders are fighting over the body on the weekly chart. The bulls want a bull bar and the bears want a bear bar. This week so far is an inside bar on the weekly chart, which is also a breakout mode pattern. The breakout up or down will probably come next week.
See the weekly update for a discussion of the price action on the weekly candlestick chart and for what to expect going into next week.
Trading Room
Traders can see the end of the day bar-by-bar price action report by signing up for free at BrooksPriceAction.com. I talk about the detailed S&P Emini futures price action real-time throughout the day in the BrooksPriceAction.com trading room. We offer a 2 day free trial.
Charts use Pacific Standard Time
When I mention time, it is USA Pacific Standard Time (the Emini day session opens at 6:30 am PST, and closes at 1:15 pm PST). You can read background information on the intraday market reports on the Intraday Market Update page.


“Since the bears have already accomplished their goal of creating a possible good sell signal bar on the weekly chart, they do not need lower prices this week. They will therefore simply try to prevent a strong reversal back up”
=> Market Rope-a-Dope ! — it’s astonishing how often the direction in control follows the career-prolonging, if not life-prolonging, strategy of The Greatest.
Al, thanks for your insights re inside, ii, & outside bars
Charles
Still new at this but I have to say, after watching your videos on gaps, today was a very good day. Caught the ride up, as well as the ride down. I kept looking left and thinking, “another filled.”
Dear Al,
EU/USD – I find it bit difficult to decide which direction to trade when market has 3 legs down (e.g. on hourly chart) but price is still well below MA. What will be your preference in this situation i.e. buy and then scale in lower for 10-20pips scalp or will you continue selling and scaling in higher (close to MA)?
Regards,
Saad
It depends on a trader’s goals and time frame. The odds are that there will a lower high and then a test down to 1.5 to 1.16. But, if a trader is day trading the 5 minute chart, the 60 minute chart becomes less important. He will scalp on the 5 minute chart.
Whenever something is unclear, the chart is probably converting into a trading range. Traders will look to buy reversals up from support and sell reversals down from resistance. Some will use wide stops and scale in. But, most will take quick profits because the confusion means that a sustained move is unlikely.