Emini rally weakening in sell zone above February low
I will update again at the end of the day.
Pre-Open market analysis
The Emini broke above another resistance level yesterday by going above the December 12 low. Since November was a bull doji on the monthly chart, it was a weak sell signal. Consequently, the limit order bulls who bought that low are buying more, trying to get back above that 2632.50 low.
Other bulls expect the Emini to get there as well and are buying. The bears know it is a magnet. Many therefore are waiting to sell until the Emini gets there. Consequently, the Emini might get vacuumed up there within a couple of weeks.
The bull trend is weakening. Fifteen minutes before the close yesterday, I said that the Emini would drop below the open at the end of the day. This is because a pullback is becoming increasingly likely. In addition, I said that today would probably trade below yesterday’s low, making today a pullback day.
While it will probably only last 1 – 3 days, The Emini could drop to last week’s low. In either case, the Emini will still probably work up to the November low within the next few weeks.
Overnight Emini Globex trading
The Emini is down 13 points in the Globex session. It will therefore open around yesterday’s low. The result is that today will probably trade below yesterday’s low and therefore be a pullback day.
Since there have been many surprisingly big days over the past month, there is an increased chance of a big trend day up or down. This is especially true with the Emini in the sell zone around several breakout points at the bottom of the 2018 range.
While it is easy to imagine a big bear day in an overbought market at resistance, traders cannot ignore the opposite. The 3 week rally has been strong enough to have 3 legs up. Also, yesterday’s range was small. Therefore, if today triggers the Low 2 sell signal by falling below yesterday’s low, traders need to be aware that today could rally up above yesterday’s high. That would form an outside up day and be a continuation of the 3 week rally.
But, most of the days over the past week have had swings up and down. In addition, they have spent a lot of time within tight ranges. This trading range price action will probably continue today.
Yesterday’s setups

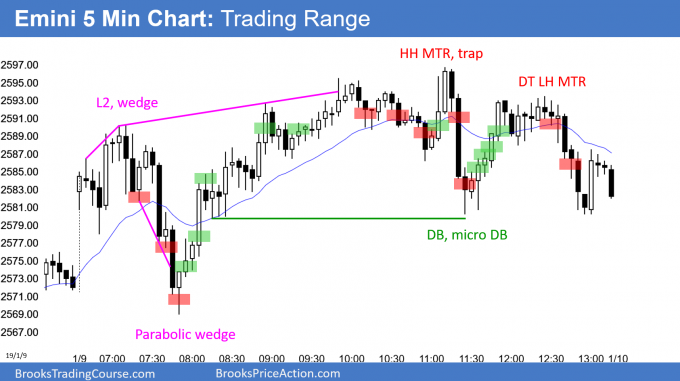
Here are several reasonable stop entry setups from yesterday. I show each buy entry with a green rectangle and each sell entry with a red rectangle. I rarely also show limit order entries and entries on the close of bars. My goal with these charts is to present an Always In perspective. If a trader was trying to be Always In or nearly Always In a position all day, and he was not currently in the market, these entries would be logical times for him to enter.
EURUSD daily Forex chart breaking above 2 month trading range

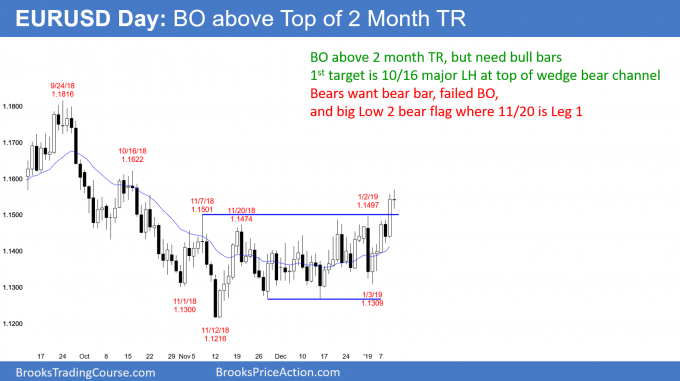
The EURUSD daily Forex chart broke above the 2 month trading range yesterday. The odds of a swing up will be greater if the bulls can create a series of bull days. However, if the bears can form a strong bear day today, the breakout could fail. It would then be the 2nd leg up in a Low 2 bear flag where November 10 rally was the 1st leg up.
I have been saying over the past week that there would probably be a breakout of the 2 month range in January. Furthermore, I said that a bull breakout was more likely because of the building buying pressure.
Yesterday was a big bull day closing far above the top of the range. What happens over the next few days will tell traders what to expect over the coming weeks. If the bulls get a big bull day today, there will probably be a strong rally up to 1.18.
What if the breakout fails?
If today is a big bear day closing on its low, traders will suspect that the breakout will fail. Today would then be a sell signal bar for a failed breakout. They would also see the breakout as the top of a Low 2 bear flag where the 1st leg up was the rally to November 20.
The daily chart has been in a trading range for 2 months. That means complacency and confusion. Most likely, that is still present, although to a lesser degree after yesterday’s breakout. Consequently, today will probably not be clear. Instead, it will probably have something for the bulls and for the bears.
Typically, when there is confusion, traders expect either a small bull or bear body. However, unless the bears get either a strong reversal down or 3 consecutive bear bars, the odds are that the breakout will continue.
The first target is the most recent major lower high. That was on November 20. Since that was also the start of a wedge bear channel, that is another reason for it to be a magnet. After that, the next targets are a 200 pip measured move up and then the September 24 major lower high around 1.18.
Overnight EURUSD Forex trading
The EURUSD 5 minute Forex chart has been in a 50 pip trading range overnight. Since today will probably have a small body on the daily chart, day traders will look to buy selloffs and sell rallies. Because the odds now favor a higher prices, traders will be more willing to hold onto longs for a test up to 1.17 or 1.18 over the next few weeks.
While today could still become a big bull or bear trend day, the overnight price action lacks energy. The bars are small, have prominent tails, and are in tight trading ranges. That makes a trading range day likely.
The key price is the 1.1543 open of the day. This is because the bulls want a bull body. Therefore, if today closes above that price, there will be an increased chance of a success breakout. Consequently, bulls will look to buy below it and bears will look to sell around it.
The bears want the day to close on its low. However, the overnight price action lacks conviction. The result will probably be a trading range day that closes slightly above or below the open.
Summary of today’s S&P Emini futures price action and what to expect tomorrow

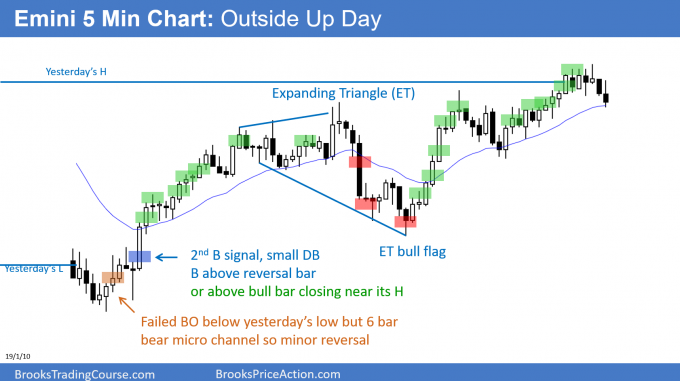
Here are several reasonable stop entry setups for today. I show each buy entry with a green rectangle and each sell entry with a red rectangle. I rarely also show limit order entries and entries on the close of bars. My goal with these charts is to present an Always In perspective. If a trader was trying to be Always In or nearly Always In a position all day, and he was not currently in the market, these entries would be logical times for him to enter.
The Emini triggered the Low 2 sell signal on the daily chart by trading below yesterday’s low. It reversed up strongly. After trading sideways, the bulls got a breakout above yesterday’s high. Today was an outside up day, which is a sign of strength.
By going outside up, today is the 3rd push up in a tight bull channel. If there is a reversal down, it will be from a parabolic wedge. However, the rally has been strong. Therefore, the bulls will buy the 1st reversal down, even if it is surprising deep.
After a couple weeks of mostly trading range trading, tomorrow will probably be similar. Despite the sharp reversals, there has been at least one swing trade up or down every day.
Because tomorrow is Friday, weekly support and resistance can be important. This is especially true in the final hour. The most important magnets are the breakout points at the bottom of the 2018 trading range. The most important is the February low.
See the weekly update for a discussion of the price action on the weekly candlestick chart and for what to expect going into next week.
Trading Room
Traders can see the end of the day bar-by-bar price action report by signing up for free at BrooksPriceAction.com. I talk about the detailed S&P Emini futures price action real-time throughout the day in the BrooksPriceAction.com trading room. We offer a 2 day free trial.
Charts use Pacific Standard Time
When I mention time, it is USA Pacific Standard Time (the Emini day session opens at 6:30 am PST, and closes at 1:15 pm PST). You can read background information on the intraday market reports on the Intraday Market Update page.
Hi Al, bear bar 4. Was there reason why not to sell below? thx
It was a short, but coming into the day, there was a decent chance of an outside up day. The daily chart has been strong, yesterday was a doji and therefore a weak sell signal bar, yesterday’s range was small, and the November low is a magnet above. Unless the selling is dramatically strong, I don’t want to sell that far below the average price. The odds favored an early reversal up.
thank you
Hi Al, bear with me for another question 🙂 in the trading room you said if you scalped below #44 and then #45 immediately goes up, you will sell more – can you explain the rational behind this? if that happens I guess I would be scared that #44 might be a bear trap, and I would probably only be thinking about getting out above #45 if it is a good bull bar closing on its high… Thank you!
The bar was so big, it was a huge Surprise Bar. That traps traders who will look for any bounce to sell. Had I sold more, but saw a strong rally, like 54 or 54 and 55, I would get out. Usually a big Surprise Bar has at least one more leg, like today.
Hi Al, I bought above #6 but got disappointed by #10 when it was developing and I got out break even, mainly because #10 closed the potential gap b/w #6 and #8, I became a lot less bullish even after #11 considering the overall context. In general, when I am expecting a reversal, I tend to look for “subtle” gaps at the early stage like the one b/w #6 and #8 to help me evaluate the strongness of bulls or bears, if there is one or two I tend to be more confident on the probability of the reversal becoming successful. Do you think I am making somewhat correct assumption, or am I giving too much weight to this kind of gaps?