Emini selloff testing 2017 close and October 11 low
I will update again at the end of the day.
Pre-Open market analysis
Since late October, I have been saying that the Emini would test the October 17 major lower high and stall. In addition, I mentioned that it might pull back 50% to the October 11 low and the close of last year. This week’s selloff achieved those objectives. Finally, I said that if the bulls could get a reversal up from around 2700, they would have a head and shoulders bottom. That would increase their chance of a breakout above the October 17 high.
I have been writing that the bears see November 7 as a double top bear flag with the October 17 high. Even at the close of the November 7 big bull day, I said that the Emini had a 40% chance of reversing down from a double top bear flag with the October 17 high, breaking below the October 29 neck line, and falling for a 200 point measured move down. Nothing has changed. Despite Monday’s strong selloff, a break above the November 7 high is still more likely than a move below the October 29 low.
Weak sell signal on weekly chart
Look at the weekly chart. The past 2 weeks had decent bull bodies after a 2 legged sell climax. Typically, there are more buyers than sellers below the 2nd bull bar.
Today broke below last week’s low. The next few days are important. This week is the entry bar for the reversal down on the weekly chart. Because last week had a big bull body, it is a weak sell signal bar. When the bears have a bad sell signal bar, they need a strong entry bar if they are going to be successful. If the bears fail to create a big bear bar this week, it would make it even more likely that the sell signal will fail. Traders will buy a reversal up.
Overnight Emini Globex trading
The Emini is up 12 points in the Globex session. Furthermore, it is 30 points above the Globex low. But, after 3 big bear days, there are probably more sellers than buyers above yesterday’s high. Traders will therefore sell a rally to that level today.
Yesterday was a doji bar on the daily chart. That is a 1 day trading range. Also, I wrote that the Emini would retrace about 50% of the early November rally, and test the 2700 Big Round Number and the close of last year. It is in that buy zone now. As a result, traders will buy selloffs.
With traders selling rallies and buying selloffs, the Emini will probably be sideways for several days. In addition, it will probably have increasing trading range price action on the 5 minute chart.
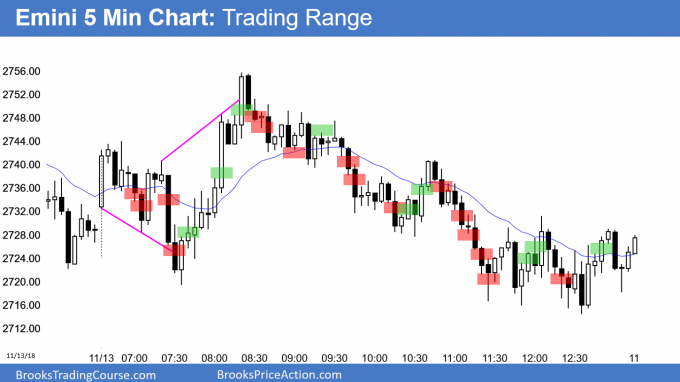
Yesterday’s setups
Here are several reasonable stop entry setups from yesterday. I show each buy entry with a green rectangle and each sell entry with a red rectangle. I rarely also show limit order entries and entries on the close of bars. My goal with these charts is to present an Always In perspective. If a trader was trying to be Always In or nearly Always In a position all day, and he was not currently in the market, these entries would be logical times for him to enter.
EURUSD Forex bear flag more likely than wedge bottom
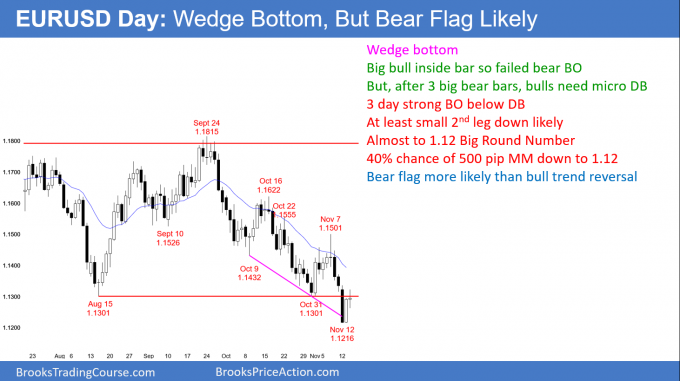
The EURUSD daily Forex chart broke below the August/October double bottom. Because 4 big bear days represents strong selling, at least a small 2nd leg down is likely. The bulls want the breakout to fail and they have a wedge bottom. But, after 3 big bear days, they will need at least a micro double bottom.
Over the weekend, I said that the EURUSD Forex market would fall below the August/October double bottom and test the 1.1200 Big Round Number. That is also the bottom of a channel on the weekly chart (not shown) drawn from the November 7, 2107 low and the August 15 low. Furthermore, the selloff is still a test of the top of the 2015 -2016 trading range. Consequently, if the bulls can get a reversal up within the next couple of weeks, the rally would have a 50% chance of reaching the July/September double top at around 1.18 over the next few months.
Since the 8 week bear channel is tight, the bulls will probably have to stop the selling for 2 – 3 weeks before there is a 300 pip rally. Next, they will need a micro double bottom. If they can create a good buy signal bar, traders will buy. This would be a reversal up from a yearlong wedge bull flag on the weekly chart and a month-long wedge bottom on the daily chart.
Momentum down favors at least slightly lower prices
Traders need to remember that the momentum down over the past 2 months has been strong on the weekly chart (not shown). In addition, there is no credible bottom yet on that chart. Even though the bears have failed to get 2 big bear bars closing on their lows, the momentum continues to favor at least slightly lower prices. They still have a 40% chance of a 500 pip measured move down to 1.08 from the 6 month double top. Consequently, the bears will to sell rallies.
However, if the daily chart stops going down, the bulls will probably get at least a 200 pip rally over the next few weeks. If they do, they will hope that it is the start of a 1 – 2 month, 600 pip swing up to the October high.
But, there is resistance at the November 7 and October 16 major lower highs. Therefore, if the bulls get their reversal, the 1st rally will likely lead to a 1 – 2 month trading range. Then, several weeks from now, they could create a credible major trend reversal.
The bears will sell at both of those lower highs and again at the 20 day EMA. They will continue to sell until the bulls get a sustained strong reversal up. There is no sign of that yet.
While the bears have broken below the range, most breakouts fail. Therefore, even though they have been in control for 2 month, the bulls will probably regain control for a 200 – 300 pip leg up within a few weeks.
Overnight EURUSD Forex trading
The EURUSD 5 minute Forex chart continued yesterday’s rally overnight. Since there is a wedge bottom on the daily chart, the bulls want a 300 pip rally to the November 7 lower high. However, the 3 day selloff has been strong. Typically the 1st reversal up only lasts 1 – 3 days before there is a test back down. Consequently, the bears will look to sell today or tomorrow, expecting at least a 50% retracement of the 2 day bounce.
Summary of today’s S&P Emini futures price action and what to expect tomorrow
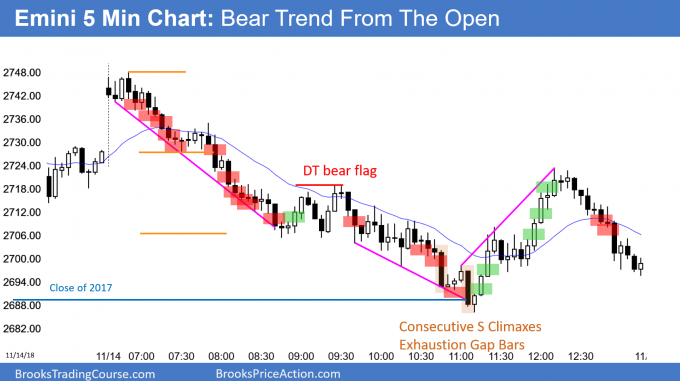
Here are several reasonable stop entry setups for today. I show each buy entry with a green rectangle and each sell entry with a red rectangle. I rarely also show limit order entries and entries on the close of bars. My goal with these charts is to present an Always In perspective. If a trader was trying to be Always In or nearly Always In a position all day, and he was not currently in the market, these entries would be logical times for him to enter.
The Emini gapped above yesterday’s bear channel, but reversed down from the 60 minute EMA. It was a Bear Trend From The Open. It reversed up strongly to last week’s low after consecutive sell climaxes to below last year’s 2689.75 close. It also closed a gap on the daily chart. However, it sold off again into the close.
Today was a reversal day, but the rally retraced half of the selloff and then failed. The Big Down, Big Up, Big Down creates Big Confusion. Therefore, tomorrow will probably have a lot of trading range price action.
See the weekly update for a discussion of the price action on the weekly candlestick chart and for what to expect going into next week.
Trading Room
Traders can see the end of the day bar-by-bar price action report by signing up for free at BrooksPriceAction.com. I talk about the detailed S&P Emini futures price action real-time throughout the day in the BrooksPriceAction.com trading room. We offer a 2 day free trial.
Charts use Pacific Standard Time
When I mention time, it is USA Pacific Standard Time (the Emini day session opens at 6:30 am PST, and closes at 1:15 pm PST). You can read background information on the intraday market reports on the Intraday Market Update page.


