Emini strong reversal up to 2800 after gap test
I will update again at the end of the day.
Pre-Open market analysis
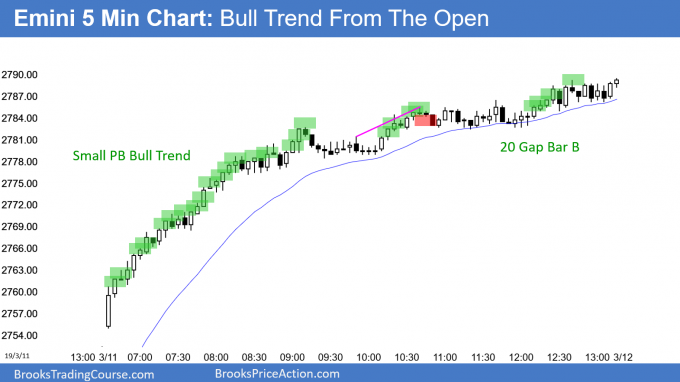
I wrote before yesterday’s open that the wedge bottom on the 60 minute chart would probably lead to a rally yesterday. The reversal up was from a test of the February 12 gap. This rally is another attempt to break strongly above 2800. That has been resistance for over a year.
Yesterday’s rally was extreme and therefore unsustainable. That makes it a buy climax. Buy climaxes created exhausted bulls who take profits. The Emini will probably go sideways to a little down for a day or two starting today or tomorrow.
But, the momentum up is strong. The bulls will buy pullbacks. They expect the rally to continue to above the 2800 start of the bear channel on the 60 minute chart.
Overnight Emini Globex trading
The Emini is up 4 points in the Globex session. There might be a small gap up on the open. Small gaps typically close in the 1st hour.
Yesterday was a buy climax. Today therefore has a 50% chance of follow-through buying on the open. The next target is the 2800 Big Round Number. However, there is only a 25% chance of another strong bull trend day that lasts all day.
There is a 75% chance of at least 2 hours of sideways to down trading that will start by the end of the 2nd hour. While it is possible that today will be a bear trend day, it is more likely that the best the bears will get is a trading range.
Since there were 3 legs up yesterday, there is a wedge bull channel. The bears might be able to test the bottom of the 1st or 2nd pullbacks in the wedge. That would be a test down to around 2800.
Yesterday’s setups

Here are several reasonable stop entry setups from yesterday. I show each buy entry with a green rectangle and each sell entry with a red rectangle. I rarely also show limit order entries and entries on the close of bars. My goal with these charts is to present an Always In perspective. If a trader was trying to be Always In or nearly Always In a position all day, and he was not currently in the market, these entries would be logical times for him to enter.
EURUSD Forex market trading strategies

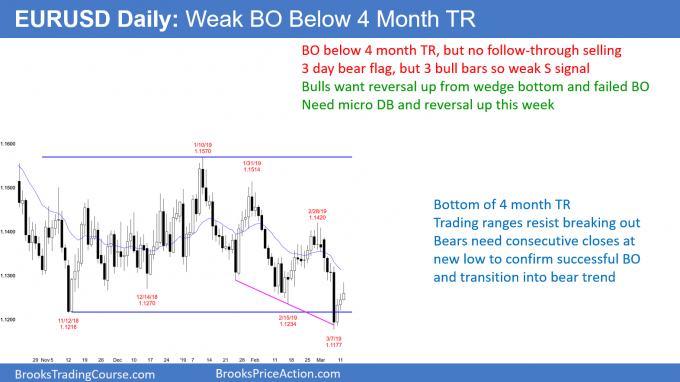
The EURUSD daily Forex chart so far has its 3rd consecutive bull bar after the bear breakout below the 4 month range. The selloff from the January 10 high is also in a wedge bear channel. A bear channel is a bull flag. That means there is usually a bull breakout.
However, the 6 day selloff to the new low was strong enough to make most bulls want to see a micro double bottom. Therefore, this 3 day rally will probably have a pull back within a few days to test last week’s low.
The bears see the 3 day rally as a pullback from the breakout below the 4 month range. But, there has been no follow-through selling. In addition, most breakout attempts fail. They need consecutive closes at a new low to make traders believe that this bear breakout is the start of a bear trend. Without that, the odds are that it is just another strong leg in the 4 month range.
The 3 day rally is strong enough so that the bears will probably need a micro double top before they can attempt again to break below the range. With the bears needing a micro double top and the bulls needing a micro double bottom, the next few days will probably be sideways.
Overnight EURUSD Forex trading
The EURUSD 5 minute Forex chart has been in a 35 pip range overnight. The bulls are trying to erase the March 7 sell climax. Its high is therefore a magnet. It is only about 30 pips above today’s current high. The momentum up over the past 3 days is strong enough for the bulls to reach that target this week. If they do, the daily chart will be back to neutral after being slightly bearish last week.
Because this 3 day rally has not been particularly strong, it will probably lead to several sideways days instead of a bull trend. Day traders will expect to scalp for 10 – 20 pips, as they have been doing for most days over the past 4 months.
Summary of today’s S&P Emini futures price action and what to expect tomorrow

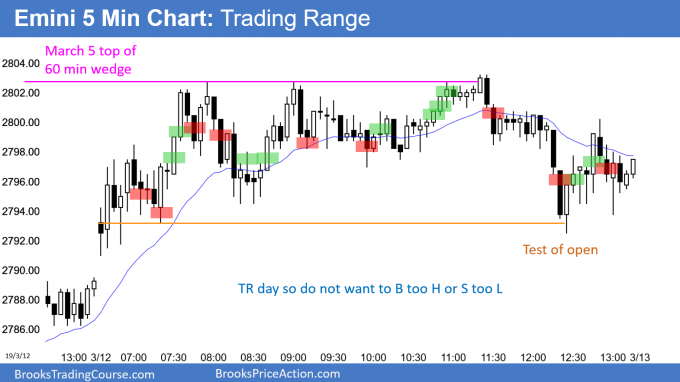
Here are several reasonable stop entry setups for today. I show each buy entry with a green rectangle and each sell entry with a red rectangle. I rarely also show limit order entries and entries on the close of bars. My goal with these charts is to present an Always In perspective. If a trader was trying to be Always In or nearly Always In a position all day, and he was not currently in the market, these entries would be logical times for him to enter.
End of day summary
As I said before the open, after yesterday’s extreme buy climax, there was a 75% chance of at least 2 hours of sideways trading that would begin by the end of the 2nd hour. Today spent several hours in a tight range. Because it was a bull day, it was follow-through buying.
However, it is stalling at the top of the channel on the 60 minute chart and at the 2800 Big Round Number. Also, the bulls have already achieved their goals on the weekly chart. They prevented this week so far from falling below last week’s low and triggering a sell signal. In addition, the week might be a bull ioi buy signal on the weekly chart.
Since they do not need to do more, the Emini might continue today’s trading range for the rest of the week. Less likely, the Emini will continue up to above the March high.
Tomorrow might gap down, but an island top is a minor reversal.
See the weekly update for a discussion of the price action on the weekly chart and for what to expect going into next week.
Trading Room
Traders can see the end of the day bar-by-bar price action report by signing up for free at BrooksPriceAction.com. I talk about the detailed S&P Emini futures price action real-time throughout the day in the BrooksPriceAction.com trading room. We offer a 2 day free trial.
Charts use Pacific Standard Time
When I mention time, it is USA Pacific Standard Time (the Emini day session opens at 6:30 am PST, and closes at 1:15 pm PST). You can read background information on the intraday market reports on the Intraday Market Update page.