Emini testing 2800 Big Round Number and November high
I will update again at the end of the day.
Pre-Open market analysis
Yesterday had a bear body, despite the huge gap up. I wrote on Friday that this was likely because a 6th bull day would be unusual. The bears want a lower high compared to the November high, and another failure at 2800. However, the 5 bulls days signify strong bulls. Consequently, the bulls will buy the 1st 1 – 3 day pullback. Therefore, there are probably buyers not far below today’s low.
Since the rally was climactic and the Emini is at resistance, the odds favor 1 – 3 sideways to down days. This is especially true with an unemployment report coming on Friday.
If the Emini gaps down this week, it will form another island top. However, island tops and bottoms are minor reversal setups.
What about the China trade news? Who cares? I am only interested in the charts, which reflect the composite of institutional opinion. They tell me if more dollars are buying or selling, and I want to do what the institutions are doing. They cannot hide it. The charts show us.
Overnight Emini Globex trading
The Emini is down 7 points in the Globex session. Today will therefore probably open in the middle of yesterday’s range. While yesterday had a bear body, it held above Friday’s low. It was therefore a pause day, but not a pullback.
The Emini now has had 6 days without a pullback. While that is a sign of strong bulls, it is also becoming climactic. Consequently, the odds of a pullback are increasing. Yesterday’s bear body increase the chance of a pullback today. There will probably be a pullback today or tomorrow. In addition, Friday’s high is not far below. It is the bottom of yesterday’s gap up and therefore a magnet.
Six days without a pullback is a 7 day bull micro channel. That is a sign of persistent and strong bulls. They typically will buy the 1st 1 – 3 day pullback. Consequently, there are probably buyers not far below yesterday’s low.
Yesterday was a trading range day in a buy climax. Friday’s unemployment report is a catalyst. The odds are that today will be another mostly sideways day.
Yesterday’s setups
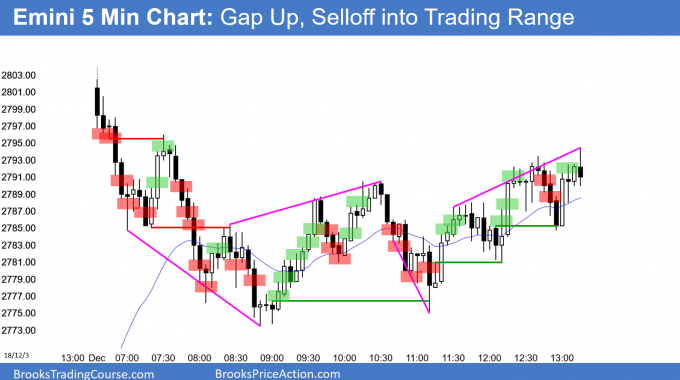
Here are several reasonable stop entry setups from yesterday. I show each buy entry with a green rectangle and each sell entry with a red rectangle. I rarely also show limit order entries and entries on the close of bars. My goal with these charts is to present an Always In perspective. If a trader was trying to be Always In or nearly Always In a position all day, and he was not currently in the market, these entries would be logical times for him to enter.
EURUSD Forex nested head and shoulders bottom
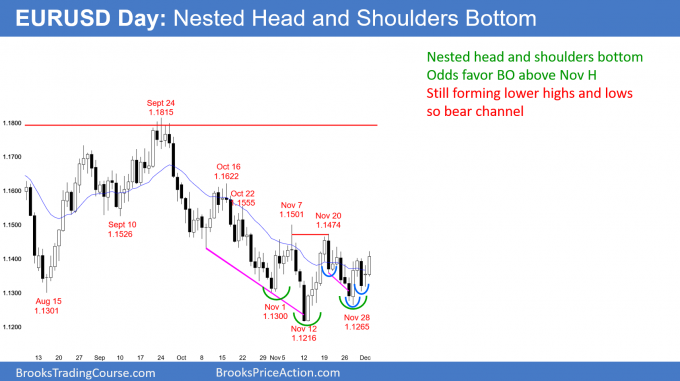
The EURUSD daily Forex chart has been in a trading range for a month. The bears want the bear channel to break to a new how. But, the bulls have a head and shoulders bottom. The right shoulder is a smaller head and shoulders bottom.
The EURUSD daily Forex chart has a nested head and shoulders bottom. That slightly increases the odds of a break above the November highs, which form the neck line. If there is a strong breakout, the rally will likely continue up to the October 16 top of the 2 month bear channel.
Until the bulls begin to form higher highs, the chart is still in a bear channel. That means a bear trend. But, the chart pattern is good for the bulls. In addition, it is forming at support on the weekly chart.
Traders always want high probability trades. When the chart is in a trading range, those trades cannot exist. The chart is sideways because the bulls and bears are balanced. However, the odds are slightly better for the bulls. But, one or two big bear days would flip the odds in favor of the bears.
Overnight EURUSD Forex trading
The EURUSD 5 minute Forex chart rallied 70 pips over night. It has been in a 30 pip trading range for 5 hours. As a result, day traders have been scalping.
Since the daily chart is trying to break above a head and shoulders bottom, today’s close is important. The bulls need signs of strength. One sign is a preponderance of bull trend days. In addition, they need those days to close near their highs. Furthermore, they need some of them to close above the high of the prior day and above minor lower highs.
For example, if the bulls can close today above yesterday’s high and above last week’s high, that would be a sign of strength. If not, it would be a sign of strength for the bears.
Therefore, both will fight over those 2 highs today. The bulls will buy 20 – 30 pip selloffs and the bears will sell near those highs. If either can create a strong trend day, which is unlikely, the daily chart will be more favorable for them.
The daily chart has been reversing every few days over the past month. Most days have spent most of their time in trading ranges. Friday’s unemployment report is important. Finally, the overnight rally was weak. These factors make today likely to be another trading range day.
Summary of today’s S&P Emini futures price action and what to expect tomorrow
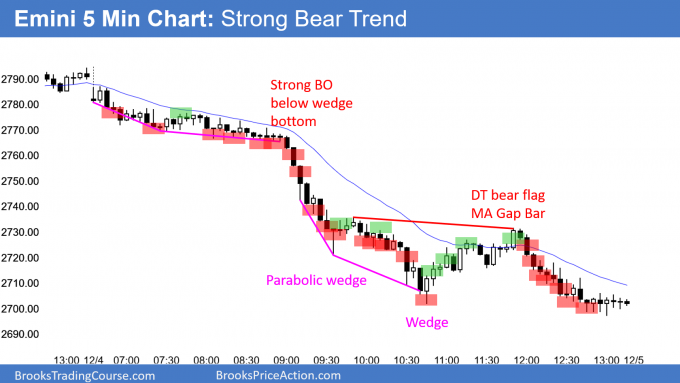
Here are several reasonable stop entry setups for today. I show each buy entry with a green rectangle and each sell entry with a red rectangle. I rarely also show limit order entries and entries on the close of bars. My goal with these charts is to present an Always In perspective. If a trader was trying to be Always In or nearly Always In a position all day, and he was not currently in the market, these entries would be logical times for him to enter.
The Emini crashed on the 5 minute chart today. It closed the gaps on the daily and weekly chart. Now, the daily chart has a Big Up, Big Down pattern, which creates confusion. Confusion typically leads to a trading range, and that is likely Thursday. Last year’s 2689.25 close has been a magnet all year. The Emini might oscillate around it for the remainder of the year.
See the weekly update for a discussion of the price action on the weekly candlestick chart and for what to expect going into next week.
Trading Room
Traders can see the end of the day bar-by-bar price action report by signing up for free at BrooksPriceAction.com. I talk about the detailed S&P Emini futures price action real-time throughout the day in the BrooksPriceAction.com trading room. We offer a 2 day free trial.
Charts use Pacific Standard Time
When I mention time, it is USA Pacific Standard Time (the Emini day session opens at 6:30 am PST, and closes at 1:15 pm PST). You can read background information on the intraday market reports on the Intraday Market Update page.


Thanks Al
Al, do you think that large Tue bear bar may relate to the short-notice reduction of trading days this week ?
Assuming that institutions were planning to be net sellers this week, they found they had 4 days to work with rather than 5, so they had to compensate with more selling than usual each day, and perhaps a large portion of that increased per-day selling got targeted for Tue, to have it transacted ahead of the Wed market closure ?
This factor alone would not change the disposition of those trading a weekly chart, but it would change that of those trading the daily chart, and that might by extension change the weekly chart, and thereby the disposition of institutions trading the weekly chart.
I will continue to be a broken record. Everything this year had to do with last year’s close. We will find out over the next few days if this was simply one final huge sell vacuum test of last year’s close. If so, it would simply be a big bear trap. I think there is a 50% chance that will be the case. The math is great for bull call buyers. Limited risk, huge upside, reasonable probability.
I already wrote my premarket report for tomorrow. In it, I talk about how about half of the selloff was options related. Options selling firms have to sell stock as the market falls, and that greatly increases the selloff. This is due to gamma (the speed at which short puts increase in value).