Emini testing resistance of lower high and moving average
Updated 6:45 a.m.
The Emini reversed up strongly from the moving average on the open. However, it was mostly sideways for the final hour of yesterday and it is within that range. In addition, it is at the target of last week’s lower high. That might be a magnet all day. The bulls want today to close above it as a sign of strength. The next major resistance is at last week’s high of 2763. That is 30 points up from here and probably too far up for the bulls to reach today. Consequently, the bulls might be content closing the day and week around last week’s lower high.
At the moment, the Emini is Always In Long. There is a 50% chance of follow-through buying on the open. If sometimes lasts an hour. If it does, the rest of the day would probably be a tight trading range. The odds are that the bull trend will begin to transition into a trading range within a couple of hours.
The bears want a failed breakout above yesterday’s high and then a bear trend. They need to get 3 or more consecutive big bear bars before traders believe that a bear swing has begun.
Pre-Open market analysis
The Emini reversed up strongly yesterday and is testing last week’s lower high at 2726.75. Since last week’s lower high is resistance, the Emini might go sideways here for a few days.
The reversal up this week is strong enough to make it likely that the 2 week correction is over. However, there might be one more sharp test down over the next several weeks. If so, it will more likley form a higher low major trend reversal on the daily chart than a breakout below the February low. That would also be a head and shoulders bottom on the 60 minute chart.
January’s midpoint is around 2780. That is therefore the average price of the January buyers. Hence, the average bull who is disappointed by the 2 week selloff might want to get out there so he can avoid a loss. That means that it is both a magnet and resistance. The odds are that this rally will get there. It is likely that there will be at least one strong test down within the next few weeks first.
Last week’s lower high is also resistance. The bulls tested it yesterday. The bears want a double top bear flag with that high. Since the reversal up on the daily chart is exceptionally strong, the odds are against a selloff to below last week’s low, which is the neck line of the double top. Any selloff will probably form a higher low.
Today is Friday and therefore weekly support and resistance are important. The bulls want to close the week above last week’s high of 2763.00. The odds are against it today. Alternatively, they would like a close above last week’s lower high of 2726.75. That is possible, but not an especially important sign of strength. The 5 day rally is more important. Finally However, they also want this week to close near its high. This week would then become a buy signal bar on the weekly chart for a 20 Gap Bar buy.
Overnight Emini Globex trading
The Emini is unchanged in the Globex session. The bulls achieved the goal that I mentioned last weekend. They rallied to above last week’s lower high. The only remaining goal for this week is to have the week close around the high of the week. That would create a strong buy signal bar on the weekly chart for next week. Since there is now a lack of incentive for the bulls today, the odds are against a strong bull day. In addition, after 2 buy climax days, the odds are that the Emini will begin to enter a trading range today.
Since yesterday was a buy climax day, there is a 75% chance of at least 2 hours of sideways to down trading that starts by the end of the 2nd hour. There is an increased chance of it beginning on the open because the bulls reached their target of last week’s lower high yesterday.
There is always a bull case. However, after a buy climax day, there is only a 25% chance of another consecutive strong bull day. Today will probably begin to transition into a trading range. But, since the correction on the daily chart is likely over, the week will probably close near the high of the week.
Yesterday’s setups
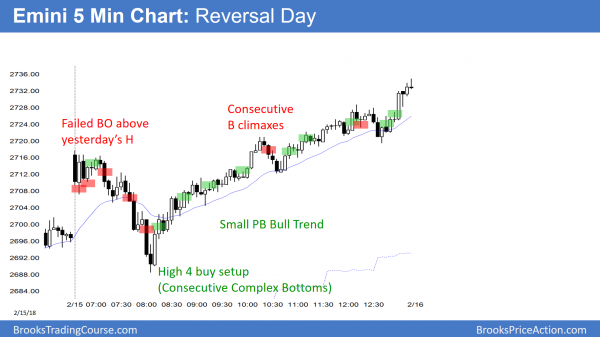
Here are several reasonable stop entry setups from yesterday. I sometimes also show limit order entries and entries on the close of bars.
EURUSD stalling at January high and 1.25 Big Round Number
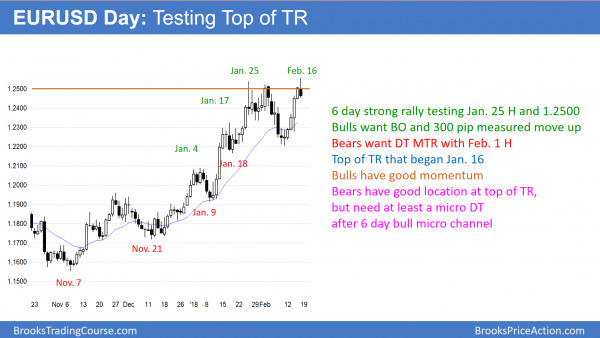
The EURUSD daily Forex chart has a 6 day rally and is testing the top of a month-long trading range.
The EURUSD daily Forex chart rallied for 6 days without a pullback. This is therefore a 6 day bull micro channel and a sign of strong bulls. Consequently, the bears will probably need at least a micro double top over the next few days before they can create a swing down.
The bulls want a strong breakout and a 300 pip measured move up, based on the height of the range. But, the early February selloff was strong enough to make a trading range more likely. Furthermore, last week was a strong bear bar on the weekly chart (not shown). It is therefore a low probably buy signal bar for this week. Hence, this week’s breakout above last week’s high is more likely to go sideways than begin a new leg up.
The momentum up over the past year favors higher prices. However, the daily chart is in a trading range. In addition, the 4 month rally might be the 3rd leg up in a yearlong parabolic wedge top on the monthly chart.
Furthermore, there is also a bear trend line around 1.26 on the monthly chart (not shown). Consequently, the location is good for the bears. The bulls need a 500 pip rally from here to break strongly above the bear trend line.
At the moment, it is more likely that the yearlong rally will continue to hesitate just below the bear trend line. The odds are that the 6 day rally will form a small double top over the next week and begin at least a small leg down.
Overnight EURUSD Forex trading
The EURUSD 5 minute chart reversed down 100 pips overnight after breaking above the January high. It has been failing at 1.2500 for a month. Since the overnight bear channel has been tight, the odds are against a bull trend today. Yet, the selloff is now just above yesterday’s low. That is support. Therefore, the odds are against much lower prices today. If the EURUSD is unlikely to go much further down and unlikely to reverse strongly up, it is left with one choice. Today will probably soon transition into a trading range.
Summary of today’s S&P Emini futures price action and what to expect tomorrow
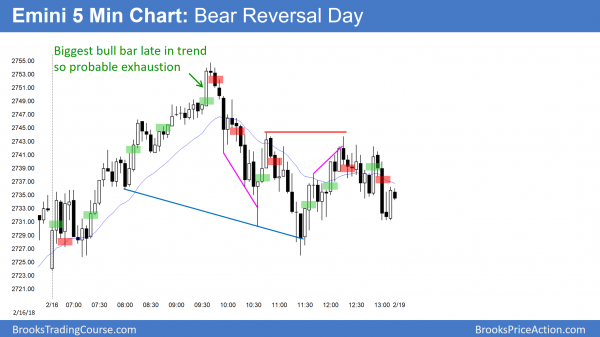
Today was the 3rd day in a tight bull channel, and that made a reversal likely.
The Emini had its 3rd consecutive small pullback bull trend day. Channels on the 5 minute chart typically end by the 3rd day. The bears got a bear reversal day today. Yet, the daily chart is still bullish, and the odds favor higher prices, even if there is a sharp selloff in the next 2 weeks.
This week is a buy signal bar on the weekly chart. Next week will probably trade above this week’s high (today’s high) and trigger the buy. However, the 2 week selloff was extreme. Therefore, the Emini will probably go mostly sideways for a couple of weeks.
See the weekly update for a discussion of the price action on the weekly candlestick chart and for what to expect going into next week.
Traders can see the end of the day bar-by-bar price action report by signing up for free at BrooksPriceAction.com. I talk about the detailed S&P Emini futures price action real-time throughout the day in the BrooksPriceAction.com trading room. We offer a 2 day free trial.
When I mention time, it is USA Pacific Standard Time (the Emini day session opens at 6:30 am PST, and closes at 1:15 pm PST). You can read background information on the intraday market reports on the Intraday Market Update page.


