Trading Update: Wednesday October 6, 2021
Emini pre-open market analysis
Emini daily chart
- Emini rallied yesterday, as I said was likely. The Emini turned up from a double bottom with the September 20 low and from the bottom of a 2-month Emini tight trading range. It is also reversing up from the 100-day MA and a micro double bottom with Friday’s low.
- The bears want either a micro double top with Friday’s high or a double top with the September 23 lower high.
- The September 23 high is just above the resistance of the 50-day MA and the big gap above the September 28 high.
- I have been saying that the big rally in August and the big selloff in September created big confusion. Confusion typically leads to a trading range. So far, the Emini has been in a tight trading range for 4 days.
- Traders are deciding if the Emini will reverse up from the bottom of the 3-month range or continue down to below 4,000.
- If there is a strong break above the September 23 high, the Emini will probably make a new all-time high. However, since the Emini has been in a trading range since July, it would probably not get much above the September high before reversing down again.
- There is a 50% chance that a 15% correction is underway. If the Emini breaks strongly below Monday’s low, which is the neckline of the micro double bottom, the odds of a test of 4,000 will be more than 50%.
Emini 5-minute chart and what to expect today
- Emini is down 35 points in the overnight Globex session. It will therefore open near the bottom of its 4-day tight trading range.
- The bears see today’s gap down from yesterday’s close as a reversal down from a double top with Monday’s high. That would be a micro double top on the daily chart.
- The bulls hope that the gap down will simply be another test of the bottom of the 4-day range. A reversal up would form a 3-day triangle.
- The 4-day trading range is 100 points tall. Traders expect a 100-point measured move up or down.
- Trading ranges resist breaking out. Therefore, it is more likely that today will form the 5th sideways day in the tight trading range.
- If the Emini is early in a bear trend on the daily chart (as I said, there is currently a 50% chance), then there is an increased risk of big bear surprises. That means a big bear day breaking far below support.
Yesterday’s Emini setups

Here are several reasonable stop entry setups from yesterday. I show each buy entry with a green rectangle and each sell entry with a red rectangle. Buyers of both the Brooks Trading Course and Encyclopedia of Chart Patterns have access to a much more detailed explanation of the swing trades for each day (see Online Course/BTC Daily Setups).
My goal with these charts is to present an Always In perspective. If a trader was trying to be Always In or nearly Always In a position all day, and he was not currently in the market, these entries would be logical times for him to enter. These therefore are swing entries.
It is important to understand that most swing setups do not lead to swing trades. As soon as traders are disappointed, many exit. Those who exit prefer to get out with a small profit (scalp), but often have to exit with a small loss.
If the risk is too big for your account, you should wait for trades with less risk or trade an alternative market like the Micro Emini.
EURUSD Forex market trading strategies
EURUSD Forex daily chart

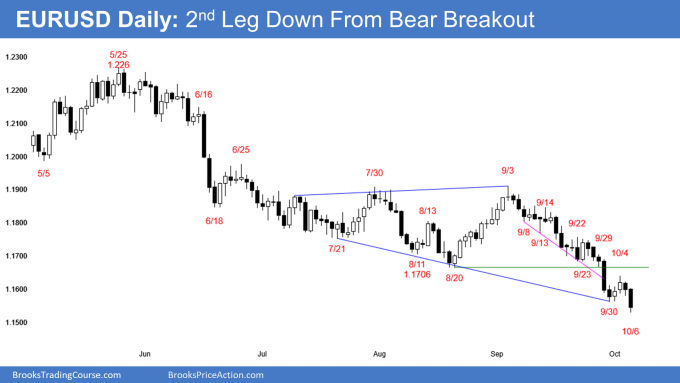
- Yesterday triggered a Low 1 sell signal, but it closed above Monday’s low. It was not a strong entry bar.
- However, today so far has been a big bear trend day.
- Because the overnight selloff lasted more than 20 bars on the 5-minute chart and it was in a tight bear channel, the odds are against a major reversal back up today. The best the bulls will probably get is a trading range.
- I have been saying that the selloff on the daily chart has been strong enough for traders to expect it to continue down to the March 9, 2020 high. That was the breakout point of the strong July 2020 rally. It is also at the 1.15 Big Round Number. When there is a strong bear leg in a trading range, it usually will test below support.
- Despite the 4-month bear trend, the selloff is still weaker than the 2020 rally and it has only retraced about half of that rally.
- It is more likely a pullback from that rally and a bear leg in a 7-year trading range than a resumption of the bear trend that began in 2008.
- The bears will need a strong break below the June 26, 2020 low before traders would expect a test of last year’s low at around 1.06.
Summary of today’s S&P Emini futures price action and what to expect tomorrow

End of day summary
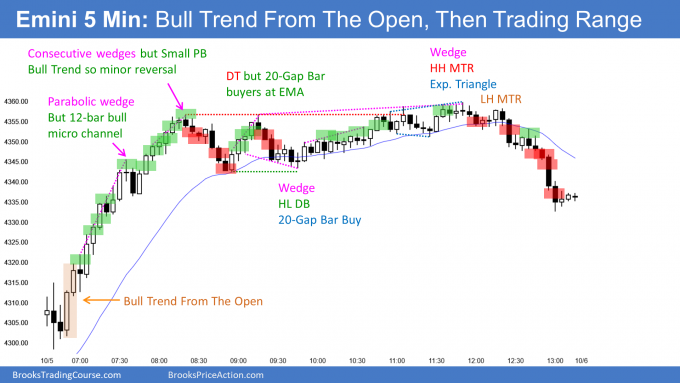
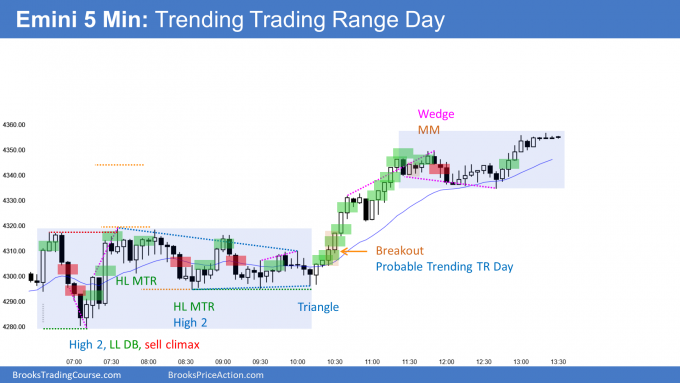
- Reversed up twice from below yesterday’s low, so High 2 bottom.
- Big Bull Surprise Bar controlled remainder of day. Day was likely to be either a trading range or a bull trend.
- After 3-hour Triangle, bulls got breakout.
- When breakout comes after protracted trading range on a day where the range is small compared to past days, usually get upper trading range. Today was Trending Trading Range Day.
- On the daily chart, it is a High 2 buy signal bar for a micro double bottom with Monday’s low. The bulls want a test of the September 23 major lower high.
- Should go at least a little higher tomorrow.
See the weekly update for a discussion of the price action on the weekly chart and for what to expect going into next week.
Trading Room
Traders can see the end of the day bar-by-bar price action report by signing up for free at BrooksPriceAction.com. I talk about the detailed S&P Emini futures price action real-time throughout the day in the BrooksPriceAction.com trading room. We offer a 2 day free trial.
Charts use Pacific Time
When I mention time, it is USA Pacific Time. The Emini day session charts begin at 6:30 am PT and end at 1:15 pm PT which is 15 minutes after the NYSE closes. You can read background information on the market reports on the Market Update page.
I’m sorry I did not see where to comment on the price action manual. When you say trading the open, do you mean the actual close and open of the futures day or the open of the NYSE thank you
When I talk about the open and close of the Emini, I mean the open and close of the day session, which is 6:30 am PT and 1:15 pm PT.
Hi Al,
When you say “When breakout comes after protracted trading range on a day where the range is small compared to past days, usually get upper trading range.”
Do you mean bulls ALWAYS have an advantage after a protracted trading range or did you refer specifically to this day situation? Thank you.
When a market is neutral (trading range), I always look back at the last time things were clear. If that trend was within 20 bars, the odds favor trend resumption.
The more bars since the trend (the more bars in the trading range), the less effect the trend has. By about 50 bars, the direction of the breakout is equally likely to be up or down.
Emini daily simple moving averages (SMA). Is there a potential typo? On the continuous contract, day session, I show the Emini daily moving up from the 150 day SMA, not 100 day SMA. The 100 day SMA appears to now be resistance for the previous three daily bars.
Thank you very much if you have time to clarify.
When I talk about 50-, 100-, 150-, and 200-day moving averages, I always mean simple, not exponential.