Posted 7:00 a.m.
Yesterday ended with a bull trend, but there were many dojis. That two sided price action continued today, and the Emini opened with a limit order market. Experienced traders are scalping with limit orders, but most traders should wait.
It is still always in long, but it is in the middle of yesterday’s channel and a trading range day is more likely than a trend day. Until this price action changes, it will be difficult for most traders and they should be patient and wait for a strong breakout with follow-through in either direction. If they trade reversals, unless a reversal is perfect, they should wait for 2nd entries.
My thoughts before the open: Bull trend within a trading range
As strong as the rally of the past two days has been, it is still a bull trend within a trading range that has lasted for about a month. The Emini is now near the top of the range, and the rally is still a lower high. The reversal up from below the range is still a lower low. The Emini is in a trading range, but the series of lower highs and lows on the 60 minute chart is also an early bear trend. The weekly and monthly charts are in bull trends. However, what is happening on the 5 minute through daily charts is very important for the monthly chart. The market remains in breakout mode, and once the breakout finally comes, it could lead to a move of hundreds of points in either direction.
Trading ranges have many strong rallies and selloffs, and this two day rally is probably just another, and not the start of the bull breakout. Since the Emini is near the top of the range and has not broken above the range yet, trading range forces are still in control. The Emini is now close to the top of the range and the bulls will probably be disappointed today. This means that a sideways to down day is more likely than a bull trend day, and that the bull trend of the past two days will probably evolve into more of a trading range today.
Summary of today’s price action and what to expect tomorrow
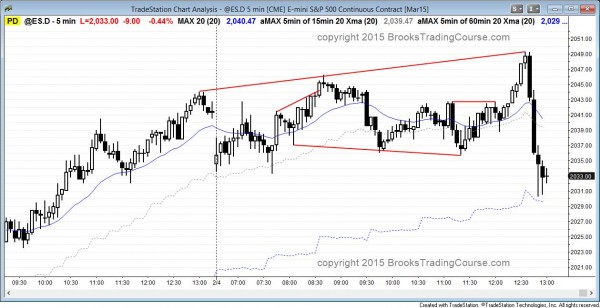
The Emini was in a trading range day. It reversed up strongly from a new low of the day, and then reversed up from a big wedge bull flag. It collapsed from an expanding triangle (not really, but similar) top after a strong bull breakout at the end of the day.
The Emini had a limit order open, but then reversed up strongly from a new low of the day, and that reversal controlled the price action for the rest of the day. After a wedge bull flag, the Emini broke above a double top and rallied to a new high of the day. It collapsed below the wedge bull flag low at the end of the day, and this is a good example of why traders who buy the close at the end of the day exit on the first pullback.
The 60 minute chart is in a trading range, but it is also in the early stages of a bear trend because it has been forming lower highs and lows. This reversal down is another lower high. Although it will not be clearly in a bear trend until it breaks strongly below the month long trading range and has follow-through selling, the current series of lower highs and lows is a sign that the bears might get their breakout.
Bears are selling up here near the top of the range. The probability is low until there is a breakout, but shorting near the top of the range means that their risk is low and their probability is high. This more than offsets the low probability. High probability traders will wait for a strong breakout in either direction.
The key area is still the 60 minute double top at 2061 and 2059.25. The market might try to get there tomorrow. That is also around January’s high of 2066.50. The bulls want to get above January’s high because Monday triggered a short on the monthly chart by falling below January’s low and the bears have their stops above that monthly candle. Even if the bulls succeed, the monthly chart would still be in a 4 month tight trading range. The bulls need a strong breakout if they are to get another leg up.
See the weekly update for a discussion of the weekly chart and for what to expect going into next week.
Traders can see the end of the day bar-by-bar price action report by signing up for free at BrooksPriceAction.com. I talk about the detailed Emini price action real-time throughout the day in the BrooksPriceAction.com trading room, and a 2 day free trial is available.
When I mention time, it is USA Pacific Standard Time (the Emini day session opens at 6:30 am PST, and closes at 1:15 pm PST). You can read background information on the intraday market reports on the Intraday Market Update page.
