Emini and Forex Trading Update:
Tuesday July 28, 2020
I will update again at the end of the day.
Pre-Open market analysis
Friday was a High 1 bull flag buy signal bar on the daily chart. The buy triggered yesterday when yesterday traded above Friday’s high. The bulls want the Small Pullback Bull Trend on the daily chart to close the gap above the February 24 high and then to continue up to a new high.
However, the Emini reversed down from within the gap. The bears hope for a 2nd reversal down this week. That would be a higher probability reversal. They hope that the 4 month rally is just a bull leg in the 3 year trading range, and that it is only a test of resistance at the February gap and the all-time high.
Traders should find out this week or next. This is the final week of the month. If July closes on its high, traders will expect a new all-time high is August. But if it closes below the June high, especially far below, they will look for a 1 – 2 month pullback beginning this week or next.
Traders might use Wednesday’s FOMC announcement or Thursday’s GDP report as the excuse for the breakout to a new high or the reversal down to below 2800. The next couple of weeks might affect the next month or two.
Overnight Emini Globex trading
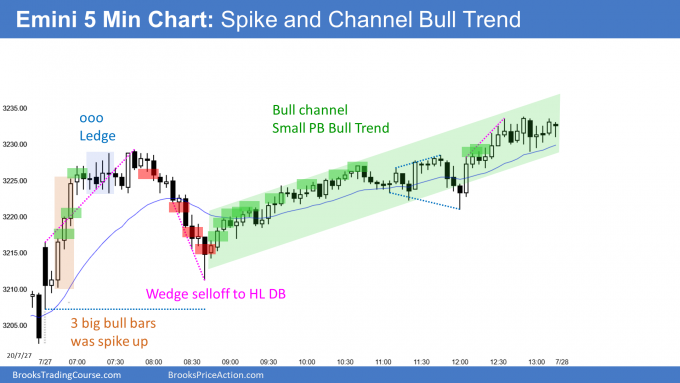
The Emini is down 9 points in the Globex session. Yesterday was in a tight bull channel. A bull channel is the same as a bear flag because there is a bear breakout 75% of the time. Today will probably gap below the bull channel.
Many bears want to see the Emini test back into the February gap one more time. If it reverses down a 2nd time without closing the gap, the bears will be more confident that a 1 – 2 month reversal has begun.
The bulls also want the Emini to get back into the gap. But they then want it to continue up to a new high over the following couple weeks.
Yesterday’s high was within 5 points of the February 24 high at the bottom of the gap. The odds are that the Emini will enter the gap today or tomorrow.
This is a very important week. Will July close above the June high or far below? The Emini might go sideways into the FOMC and GDP announcements and then use one of them as an excuse for a breakout up or down.
Yesterday’s setups

Here are several reasonable stop entry setups from yesterday. I show each buy entry with a green rectangle and each sell entry with a red rectangle. I rarely also show limit order entries and entries on the close of bars. I do not want the lines to be distracting. If they are longer, I make them dotted. But, they have to be visible, so I make the shorter ones solid. Buyers of the Brooks Trading Course and Encyclopedia of Chart Patterns have access to a much more detailed explanation of the swing trades for each day (see Online Course/BTC Daily Setups).
My goal with these charts is to present an Always In perspective. If a trader was trying to be Always In or nearly Always In a position all day, and he was not currently in the market, these entries would be logical times for him to enter.
If the risk is too big for your account, you should wait for trades with less risk or trade an alternative market like the Micro Emini.
EURUSD Forex market trading strategies

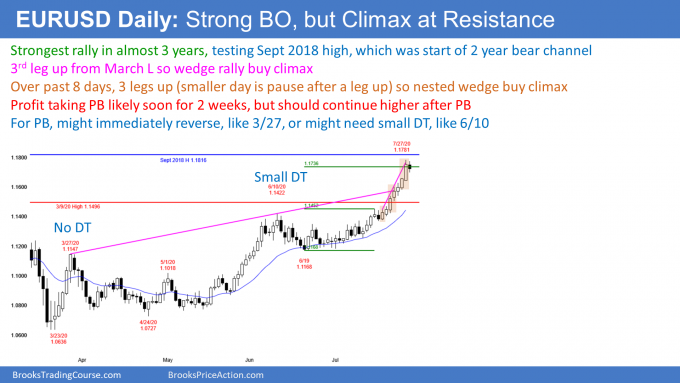
The EURUSD Forex market on the daily chart has rallied strongly for 8 days. But there have been 3 surges, which means the rally is a parabolic wedge buy climax.
Furthermore, it is within a bigger wedge bull channel from the March 23 low. This is a nested wedge buy climax at the resistance of the September 2018 high and a measured move target from the June 19 low. Traders will take profits soon.
The EURUSD might simply start to reverse down today, like it did after the March 27 buy climax. Or, there might be a 1 – 3 day pullback and then a brief rally to a double top, like in June.
However, this kind of climactic buying attracts sellers. The bulls sell out of their longs to reduce their risk. Their stop is far below so their risk is great. Also, the bears begin to sell, betting on long covering (profit taking, long liquidation).
Traders look for a couple legs down to support. Common targets are the EMA, the breakout point (the June 10 high), and the start of the most recent leg up (the bottom of the 7 consecutive bull days).
Can it continue up for several more weeks without seeing a 2 week pullback? It will do that 25% of the time. Bet on the pullback.
Today’s close is important
Today’s close is important. If the bulls can get the EURUSD back to or above the open by the end of the day, today will be a High 1 bull flag buy signal bar. Traders will look for a 1 – 3 day rally to a double top and then a reversal down. This would be like the June 10 top.
If today closes near its low, it will be a sell signal bar for tomorrow, like the March 27 high.
It could simple go sideways for a few days and form a micro double top or a bull flag that leads to a brief higher high double top. However, a top is likely and today’s close will give traders an indication of what type of top we will see.
Overnight EURUSD Forex trading
The 5 minute chart of the EURUSD Forex market had several selloffs and rallies overnight. The result is that it has been in a trading range for 8 hours. Day traders are now scalping for 20 pips up and down.
The bulls will continue to buy selloffs to get today’s close above the open. The bears will sell rallies and try to get today to close near its low. After several swings up and down overnight, today will probably remain a trading range day. Also, it will probably close near the open.
This will be unclear for tomorrow. That could result is a few sideways days before traders decide whether to begin the pullback or have one more brief leg up to the September high and then start the pullback.
Summary of today’s S&P Emini futures price action and what to expect tomorrow

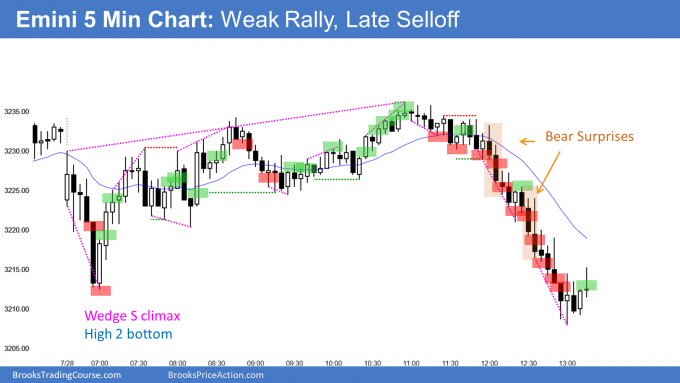
Here are several reasonable stop entry setups for today. I show each buy entry with a green rectangle and each sell entry with a red rectangle. I rarely also show limit order entries and entries on the close of bars. I do not want the lines to be distracting. If they are longer, I make them dotted. But, they have to be visible, so I make the shorter ones solid. Buyers of the Brooks Trading Course and Encyclopedia of Chart Patterns have access to a much more detailed explanation of the swing trades for each day (see Online Course/BTC Daily Setups).
My goal with these charts is to present an Always In perspective. If a trader was trying to be Always In or nearly Always In a position all day, and he was not currently in the market, these entries would be logical times for him to enter.
If the risk is too big for your account, you should wait for trades with less risk or trade an alternative market like the Micro Emini.
End of day summary
The Emini began with a plunge below the June high and a sharp reversal up from a High 2 bottom and a sell climax. The key price is the February 24 high. Many bears are waiting for one more test in the weekly gap and a 2nd reversal down from there. Today’s high was 2 points below the bottom of the gap.
Tomorrow’s FOMC report is not going to surprise anyone. The Fed is not going to do anything this close to the election. However, the market still might react as if the Fed did something drastically good or bad. Day traders should exit positions ahead of the 11 am PST announcement and not trade again until at least 10 minutes afterwards.
The Emini is in a strong bull trend on the daily and weekly charts, but the 4 month rally came after a crash in March. It is now near the all-time high, where there were sellers in February. This week and next week have the potential for a big move up or down.
Friday is the last day of the month. The Emini has been oscillating around the June high. That will probably be the most important price at the end of the week. Lots of uncertainty ahead. Traders need to be ready for anything.
See the weekly update for a discussion of the price action on the weekly chart and for what to expect going into next week.
Trading Room
Traders can see the end of the day bar-by-bar price action report by signing up for free at BrooksPriceAction.com. I talk about the detailed S&P Emini futures price action real-time throughout the day in the BrooksPriceAction.com trading room. We offer a 2 day free trial.
Charts use Pacific Standard Time
When I mention time, it is USA Pacific Standard Time (the Emini day session opens at 6:30 am PST, and closes at 1:15 pm PST). You can read background information on the intraday market reports on the Market Update page.
Hi Al,
Thanks for all of your insights. Can you recommend other skilled traders sharing their wisdom like you do? Someone you listen to who writes a blog or similar?
Thank you 🙂
Hi Al
Wasn’t bar22 failed BO above 18 bar range? Therefore credible swing sell ?
Hi Al,
If a trader can do really well with just one or two setups, would you consider them a great trader?
As a trader, it sometimes feels like one needs to know a lot of setups to take advangtage of every market condition but I’ve experienced very good results just sticking to two setups and in my own way mastering them.
I feel like all of us want to be the greatest in our own way but we don’t necessarily need to know every setup to be the “greatest”, right?
Curious what you think.
Thanks!
This is what I learnt from AI on this topic,, if you are good at doing what you know with reasonable profit continue to do and master that pattern and increase the qty.
No need to compare with anyone. If you are profitable and making good progress on your strategy there is no need to worry or compare.
Thanks!
The goal is to make consistent money, and enough money for a comfortable lifestyle. Furthermore, it has to be fun. A person can achieve that with just one setup and not many trades if he manages his trades well. Anyone who achieves that deserves everyone’s admiration and respect.
Gotcha. Thanks for the reply