Emini wedge bottom and bear micro channel sell climax
I will update again at the end of the day.
Financial Market Overview
Everything is short-term overdone. I wrote in my weekend blog that the odds are that a rally would probably begin early this week. The high of every day for the past 7 days in the S&P500 cash index has had a high below the prior day’s high. This is extreme and will likely end today or tomorrow.
Furthermore, the cash index has a 2 week parabolic wedge bottom that began with the October 10 low. That typically leads to a couple of legs sideways to up trading. There might be one more small new low, but there should be buyers around last week’s low. Furthermore, the 1st week of November is seasonally bullish.
There is a similar picture with the EURUSD daily Forex chart, and an opposite situation with the US dollar. The dollar has a wedge top where the 1st leg up was September 4 and the 2nd was October 9. Friday’s reversal probably ended the final leg in the wedge. While there is a chance of one more brief leg up, the odds are that the dollar will pull back over the next 2 weeks.
This will take pressure off the stock market, which should rally. The October selloff was in a bear spike and channel pattern. Traders will look for a test of the start of the channel over the next month. That is the October 17 high of 2817.
The selloffs in AAPL and MSFT were minimal, and AMZN and GOOGL started to reverse up on Friday. They should work higher within a week, and that will bolster the market. AAPL’s earnings are on Thursday. With AAPL in a bull flag on the daily chart and the overall market in a sell climax, the odds favor a test of all-time high within a couple of weeks.
Will the S&P test the February low? There is a lot of talk of that. At the moment, the odds favor a short term rally beginning early this week.
Pre-Open market analysis
The Emini reversed up on Friday, but closed near its open and formed a doji day. There is an 8 day bear micro channel, which is a sell climax. The odds therefore are that today will trade above Friday’s high or tomorrow will trade above today’s high.
There is also a wedge bottom on the daily chart. Furthermore, the Emini is seasonally bullish over the next week. These factors make it likely that today will trade above Friday’s high and trigger a minor buy signal.
However, while the 8 bar bear micro channel is unsustainable and therefore sell climax, it is also a sign of strong bears. Typically the 1st reversal up only lasts 1 – 2 bars before there is a pullback. Despite that, the odds favor a 1 – 2 week rally soon.
Overnight Emini Globex trading
The Emini is up 27 points in the Globex session. As I wrote after the close on Friday and on the weekend, the odds are that today will trade above Friday’s high or that tomorrow will trade above today’s high. Furthermore, Friday is a reasonable candidate for the end of the selling for the rest of the year. We’ll see.
Today will probably open around Friday’s high. Remember, the minimum goal is for today to trade 1 tick above that high. If it does, it will end the 8 day bear micro channel. Will the Emini only do the minimum or will it do much more over the next few weeks? We will find out.
What to expect if there is a rally after a sell climax
A parabolic wedge bottom typically lead to rally that has at least 2 legs and lasts about half as long as the wedge. Because the wedge lasted 3 weeks, the rally might last at least a week. The next objective is a test of the top of the wedge, which is around 2820.
Since the selling was so strong, if there is a rally, it will probably be tentative, in a channel, with many pullbacks. That means it will look uncertain, and traders will constantly wonder if it is a bear flag and if the bear trend will soon resume. This is in contrast to a relentless, clear, strong bull breakout for several days.
Bear channels and sell climaxes usually evolve into trading ranges. That is what is likely here. While the initial rally over the next few days can be strong on the 5 minute chart, it probably will not generate a series of big bull trend days on the daily chart. A trading range on the daily chart typically creates a lot of trading range price action on the smaller time frames.
Friday’s setups
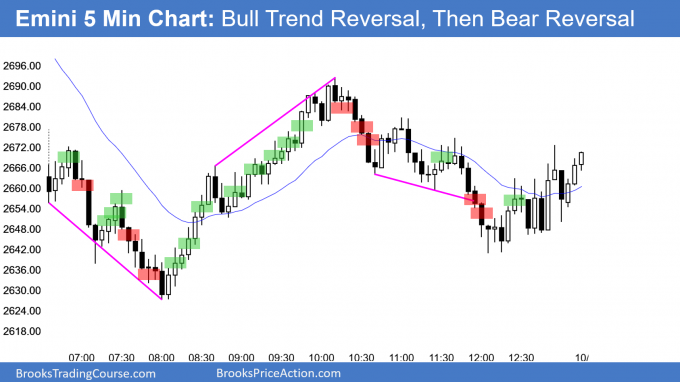
Here are several reasonable stop entry setups from Friday. I show each buy entry with a green rectangle and each sell entry with a red rectangle. I rarely also show limit order entries and entries on the close of bars. My goal with these charts is to present an Always In perspective. If a trader was trying to be Always In or nearly Always In a position all day, and he was not currently in the market, these entries would be logical times for him to enter.
EURUSD daily Forex chart has parabolic wedge bottom
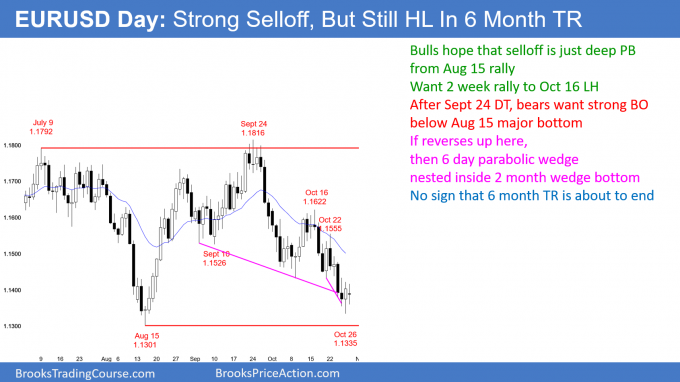
The EURUSD daily Forex chart formed a bull reversal day on Friday. There is a nested parabolic wedge and it is above the August 15 bull trend reversal low.
The EURUSD daily Forex chart has sold off for 5 weeks. Yet, the low is still above the August 15 bull trend reversal low. The selloff therefore can still simply be a deep pullback in a bull trend.
It is clearly a strong bear leg in the 6 month trading range. Trading ranges have many strong bull and bear legs, but 80% of them lead to reversals and not successful breakouts. Consequently, this one will probably reverse up as well. That is true even if it falls below the August low for a few days.
Because there is a 6 day parabolic wedge withing an 8 week parabolic wedge, there is a nested sell climax bottom. The odds favor a 2 week rally back to the middle of the 6 week range. A reasonable target is the October 16 top of the 5 week bear channel.
Overnight EURUSD Forex trading
The EURUSD 5 minute Forex chart has been in a 60 pip trading range overnight. Traders are deciding if Friday is the start of a 2 week rally. Alternatively, the selloff will continue for a few more days. It might even break below the August low. However, there is only a 40% chance of a successful bear breakout, meaning a swing down.
Sell climaxes result in exhausted bears. The bears begin to prefer to sell rallies and take profits at prior lows. The bulls know this and they do the opposite. They buy near prior lows and take quick profits on tests of resistance. This typically transforms the bear trend into a trading range. That is likely to begin early this week.
Summary of today’s S&P Emini futures price action and what to expect tomorrow
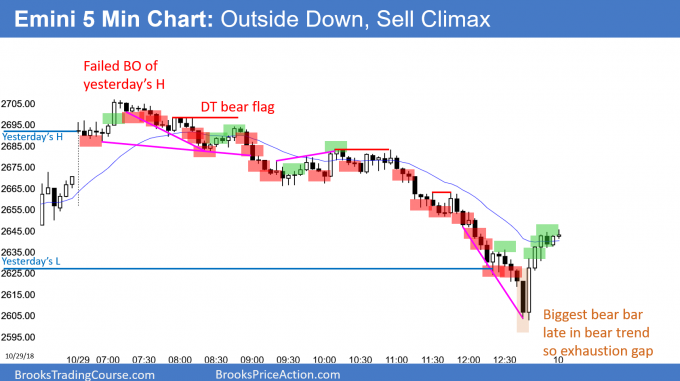
Here are several reasonable stop entry setups for today. I show each buy entry with a green rectangle and each sell entry with a red rectangle. I rarely also show limit order entries and entries on the close of bars. My goal with these charts is to present an Always In perspective. If a trader was trying to be Always In or nearly Always In a position all day, and he was not currently in the market, these entries would be logical times for him to enter.
By going above Friday’s high, the Emini ended the 8 day bear micro channel on the daily chart. However, 8 days down is a sign of strong bears. They sold above Friday’s high and the day became a broad bear channel. The selling accelerated after midday and the Emini fell below Friday’s low. Today was therefore an outside down day.
However, there is still a parabolic wedge bear channel on the daily chart. This is an extreme sell climax. Consequently, the odds favor a bounce this week. For example, if tomorrow is a bull inside day, it will be an ioi buy signal bar for Wednesday.
See the weekly update for a discussion of the price action on the weekly candlestick chart and for what to expect going into next week.
Trading Room
Traders can see the end of the day bar-by-bar price action report by signing up for free at BrooksPriceAction.com. I talk about the detailed S&P Emini futures price action real-time throughout the day in the BrooksPriceAction.com trading room. We offer a 2 day free trial.
Charts use Pacific Standard Time
When I mention time, it is USA Pacific Standard Time (the Emini day session opens at 6:30 am PST, and closes at 1:15 pm PST). You can read background information on the intraday market reports on the Intraday Market Update page.


