Greater fools theory crowded trade
Because I will not be trading today, I will be unable to provide an update.
Pre-Open Market Analysis
The Emini made a new high again yesterday and formed a 5 day island bottom. However, there was no enthusiasm. The day was small and sideways. While yesterday was an entry bar for the bulls, it was weak. The bulls need strong follow-through soon. Otherwise, the bears will try for a double top with last week’s high. Traders know that the Emini has not had a pullback in more than 20 bars. The ideal stop is still 100 points below. This increases the chances of a 2 – 5% pullback, and it can begin at any time.
Crowded trade and the Momentum Bulls
The Emini has been in a tight trading range for 2 months. Most of these bulls are momentum traders. They are not buying because they think the Emini is cheap. Instead, they are buying because it has been going up. A single 20 point bear day closing on its low will make all of those bulls losers.
They are Greater Fool Theory traders, hoping there is a greater fool who will buy from them even higher. Because of the bull trend, they know the odds are that there is. Yet, they also know the risk. Hence, this is a crowded trade. If it starts to selloff, all of those bulls will sell.
Momentum Bulls, not Value Bulls
Remember, they are long based on momentum, not value. They are not going to buy more lower. Instead, they will all sell on a bear breakout. With so many suddenly traders locked into losing positions, and so many of them being momentum bulls, the market has an increased risk of a sharp selloff.
I called them Momentum Bulls. This is in contrast to Value Bulls. A Value Bull wants a big selloff so he can buy when the market is cheap. Once he believes it is at support and the selling is about over, he buys more at each new low. These scale in bulls are not the ones buying up here at the all-time high. Therefore, there are probably not enough scale in bulls to stop a sharp selloff.
Emini Globex session
The Emini had a small selloff and reversal up last night. It therefore did nothing to change traders’ minds. The odds still favor a test of 2200 – 2220 soon.
Because yesterday was a sell climax, there is only a 25% chance of a strong bear trend today. While There is a 50% chance of some follow-through selling in the 1st 2 hours, there is a 75% chance of 2 hours of sideways to up trading that begins by the end of the 2nd hour.
Forex: Best trading strategies
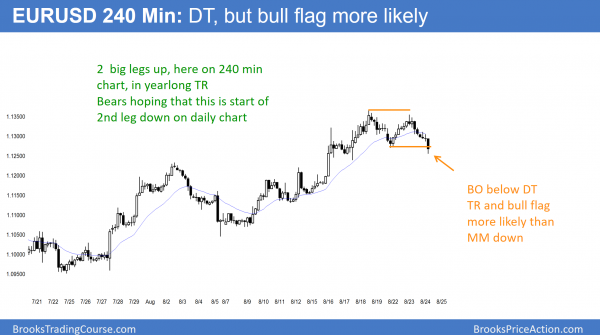
The 240 minute EURUSD Forex chart has a double top at the end of 2 big legs up. Yet, most reversals fail. Furthermore, there is still room to the June 24 lower high above. The odds are that the selloff will not fall far before the bulls buy it. The target for the bears is the August 2 breakout point of 1.1233, which is near the moving average on the daily chart.
The entire August rally is a pullback from the 1st leg down from the May 3 buy climax on the daily chart. The bears see the August rally as a double top right shoulder of a Head and Shoulders Top. The Head is the May 3 high.
EURUSD overnight sessions
The EURUSD Forex chart sold off over the past hours. It is near the August 17 1.1249 bottom of the trading range of the past 2 weeks. The selloff is a sell vacuum test of that support. The best the bulls will probably get this week is a bounce at the support, and then a trading range for a couple of days. Because the chart is down to the tight trading range of August 16 and 17, and the overnight selling on the 5 minute chart was climactic, the odds are that the strong bear trend will end soon and will evolve into a trading range.
The 60 minute EURUSD chart turned down from a Lower High Major Trend Reversal Yesterday. It was also a Head and Shoulders Top. Most reversal patterns evolve into trading ranges. That is what is therefore likely here. Only about 40% lead to actual opposite trends.
The 1st target for the bears always is the most recent major higher low. That is the August 21 higher low around 1.1270. The next target is the August 2 breakout point around 1.1230. The bulls hope for a Double Bottom Bull Flag at one of the support levels. The bears want at least a measured move down. Since the pattern is about 100 pips tall, they want a test around 1.1150. This is also the August 11 higher low. That is also the bottom of the bull channel.
Bulls see bull flag
The bulls see the two legs down from the August 18 Wedge Top as forming a High 2 bull flag. Yet, traders will not believe that the bulls are in control until the bulls break above the most recent lower high. While a break above that high ends the bear channel, it does not create a bull trend. More likely, it leads to more trading range trading.
Summary of today’s S&P Emini futures price action and what to expect tomorrow
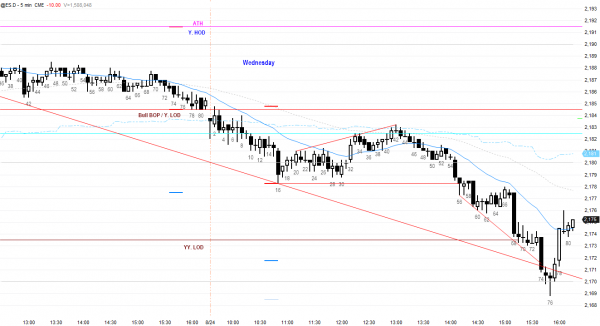
Today’s chart posted for reference (US EDT). Al away today.
See the weekly update for a discussion of the price action on the weekly candlestick chart and for what to expect going into next week.
Traders can see the end of the day bar-by-bar price action report by signing up for free at BrooksPriceAction.com. I talk about the detailed S&P Emini futures price action real-time throughout the day in the BrooksPriceAction.com trading room. We offer a 2 day free trial.
When I mention time, it is USA Pacific Standard Time (the Emini day session opens at 6:30 am PST, and closes at 1:15 pm PST). You can read background information on the intraday market reports on the Intraday Market Update page.

