September unemployment report and Federal Reserve interest rate hike
Updated 6:50 a.m.
The Emini stalled at the 60 minute moving average and the top of yesterday’s tight trading range. This is trading range price action. Yesterday’s 3 hour bull channel is a bear flag. Therefore, there is only a 25% chance of a strong bull breakout. Furthermore, there is a 75% chance of a bear breakout.
The Emini can break below the bull channel by going sideways or down. The channel can continue up for another hour or two. Yet, without a strong bull breakout, the entire rally from yesterday’s low will probably be a bull leg in a trading range. Hence, the bears will probably get a swing sideways to down that begins by the end of the 2nd hour.
The odds are that today will be mostly a trading range day. It will probably try to get neutral before tomorrow’s report. While the breakout can come today, it is not likely. Yet, if there is a strong breakout, traders cannot be in denial. They need to enter and look to swing at least part of their position.
Pre-Open Market Analysis
The Emini yesterday reversed up in the middle of the day and closed above the open of the month. Therefore August was the 7th consecutive bull trend bar on the monthly chart. If you look back over the past 5 years, you will see that about 70% of the time when this has happened, the Emini corrected down about 100 points before it went much higher. Hence, it will probably pullback to around 2100 in September or October.
While yesterday reversed up, the rally lacked consecutive big bull trend bars closing on their highs. The rally was therefore more likely a bull leg in what will become a trading range today.
Tomorrow’s unemployment report
Furthermore, tomorrow’s unemployment report will influence the Fed. A strong report will probably make the Fed raise rates this month instead of December. A rate hike would probably result in a big move. Because the market has already discounted the hike and it might have overdone the discounting, the Emini might rally on this bearish news.
Despite convincing experts on TV making proclamations about what will happen, traders need to wait to see what the market does. It is trying to get neutral before the report, which means that today will probably have a lot of trading range price action.
Emini Globex session
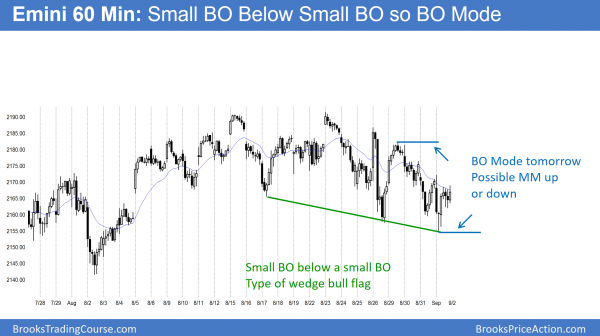
The Emini is up 3 points in the Globex session. It has had many reversals on the 60 minute chart over the past few days, and each is getting smaller. Hence, it is in breakout mode, and it might be waiting for tomorrow’s report.
Forex: Best trading strategies
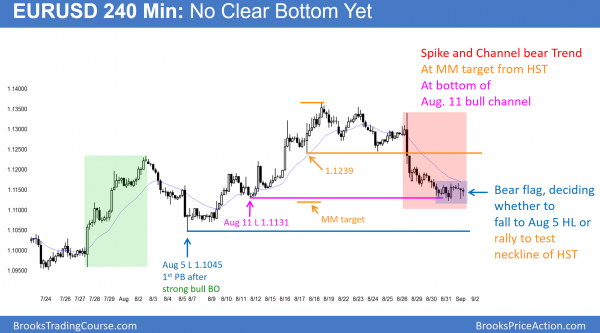
The 240 minute EURUSD Forex chart is in a trading range. It rallied in a Spike and Channel Bull Trend from July 27, and it sold off from a Head and Shoulders Top (HST) and then an August 26 Spike and Channel Bear trend. The EURUSD Forex market is looking for the bottom of the bear channel. While is at support, there is no clear bottom. It is deciding whether to rally to the 1.1239 neck line of the Head and Shoulders top, or fall to the bottom of the August 5 bull channel. Once it reverses up, the minimum goal is 2 legs and 10 bars.
I wrote yesterday that the 60 minute chart of the EURUSD Forex market had a Spike and Channel bear trend. Furthermore, it had consecutive bottoms. This combination made 2 legs sideways to up likely. While yesterday had 2 legs up, each was only a couple of bars. That is not enough to make bears want to sell again. When a bear trend lasts 50+ bars, the 2 legs sideways to up will usually be at least 10 bars. This means that yesterday’s 2 legs were probably just a 1st leg that subdivided into 2 smaller legs. The odds are that today will have a 2nd leg sideways to up.
While there is always a bear case, the probability is not high. When there is a Spike and Channel bear trend, there is a 75% chance of a bull breakout and only a 25% chance of a successful bear breakout that leads to another strong leg down.
Overnight Forex sessions
The EURUSD Forex market traded sideways for the past 3 days. It is probably waiting for tomorrow’s unemployment report before deciding on the direction of the breakout. Traders will probably only scalp today.
Since this is a sell climax, there is only a 25% chance of a successful bear breakout. The odds are that it will rally for a few days even if it breaks briefly to the downside.
Summary of today’s S&P Emini futures price action and what to expect tomorrow
The Emini sold off strongly below the bottom of the August trading range, and then reversed up strongly. The 60 minute chart has a Small BO Below a Small BO pattern. The strong rally at the end of the day was the final component. There is a 50% chance that a breakout above or below the pattern will lead to a measured move.
The Emini sold off strongly, yet reversed up from the bottom of the August trading range. It has formed a 60 minute wedge bull flag. Yet, it continues to form lower highs on the 60 minute chart. It is therefore in an early bear trend. However, it is also still in a bull trend, which is always the case when it is in a trading range.
The market is in breakout mode. The most recent trend was the July rally. Therefore the bulls have slightly higher probability than the bears. Tomorrow’s unemployment report could create a big breakout in either direction. The next catalyst is the September FOMC meeting.
See the weekly update for a discussion of the price action on the weekly candlestick chart and for what to expect going into next week.
Traders can see the end of the day bar-by-bar price action report by signing up for free at BrooksPriceAction.com. I talk about the detailed S&P Emini futures price action real-time throughout the day in the BrooksPriceAction.com trading room. We offer a 2 day free trial.
When I mention time, it is USA Pacific Standard Time (the Emini day session opens at 6:30 am PST, and closes at 1:15 pm PST). You can read background information on the intraday market reports on the Intraday Market Update page.


Al,
With the market going through its cycles and repeating patterns, do you still learn new approaches? I am in this for the long haul, but it seems as soon as I think I am anticipating the correct direction or pattern, the market teaches me something new. Do you still learn and still make mistakes?
Thank you,
Richard
Hi, Richard,
I rarely see something that I haven’t seen many times before. Everything is a variation of something, and I don’t get surprised by anything. When something happens for the 1st time in years, i sometimes don’t realize it until the next day.
Hi Al,
Just wanted to ask about your scalps. In the trading room you often say “I’ve scalped a point”. As I understand you scalp when you assess the probability of success 60% or more, for instance, buying lows of bars or selling highs. My question is what stop do you usually use for 1 point scalps?
It’s not rare, when the price goes 6 ticks above the high of a bar and then reverses and goes 11 ticks down, making those 1-point scalps. But if to use a 1 point stop, then you would be stopped out and won’t get the move.
Regards,
Anton
Hi Anton,
Al always uses a wide stop for any trade, and then manages trade to decide on whether or not to hold. If the market moved down to where a 1 point stop could be, and if the trade premise still suggests trade is Ok, Al would likely scale in below.
Note that Al is often scalping one point but keeping half or more of his position on for a potential swing. So not so straightforward.
There are many Ask Al videos on this topic in the Ask Al blog. Use the search box.
Hope that helps.
Richard
Hi Richard,
Thanks for the reply. Now it’s clear. I’ll go through the videos, thanks for this suggestion as well.