Trading S&P breakout to new all-time high: Update 6:57 a.m.
The Emini opened on its high tick above yesterday’s high and sold off in a trend from the open bear trend. It is Always In Short. The bulls want an opening reversal up from the bottom of yesterday’s tight trading range. The odds are that the bears will sell the 1st reversal and the best the bulls will get is a trading range over the 1st hour or two.
The bears have a chance of a bear trend day. Because the daily chart is so strongly bullish, if the bears get a trend, it will probably be a weak trend, like a broad bear channel or a trending trading range day. The day opened on the high tick. Only a couple days a year have the high or low on the open. This increases the chances of a new high. Alternatively, the exchange might change the high of the day’s price by the end of the day.
Trading S&P breakout to new all-time high
S&P 500 Emini: Pre-Open Market Analysis
The Emini broke to a new all-time high 2 days ago and the bulls bought again yesterday. Hence, this reaffirms the Always In Long status and it increases the chances of higher prices. While every day is a potential sell signal bar for a failed breakout above a 2 year trading range, bulls will buy the 1st reversal down.
As a result, the bears have a low probability short. The Emini has lasted many bars on the 60 minute and daily charts. Yet, there is no reasonable top. The bears will probably need at least a micro double top before they can make the bull breakout fail.
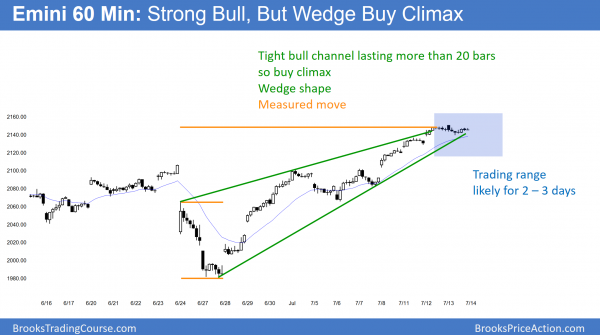
Because the 60 minute rally is extreme and at the apex of a wedge bull channel, the Emini will probably not rally too much today or tomorrow before it pulls back for several hours. It is also at a measured move up based on the height of the June 24 and June 27 bear breakout. Yet, bulls will buy the pullback. They have been buying breakouts all week, which means they are eager and confident. They are looking forward to being able to buy below the high. A pullback on the 60 minute chart could last a couple of days and fall 20 – 40 points.
Trend resumption or trend reversal?
The 5 minute chart yesterday had a tight trading range after an opening rally. The bulls want trend resumption up. However, a tight trading range late in a bull trend is often the Final Bull Flag. Therefore, trend resumption up would probably not get far before the Emini reverses back into the tight trading range. The bears want the opposite. They see a major trend reversal in the tight trading range, and they are looking for a trend reversal down.
Globex session
While the Globex session is up 5 points, the Emini is losing momentum and is overbought. However, there is no sign of a top, and the momentum favors the bulls.
Forex: Best trading strategies
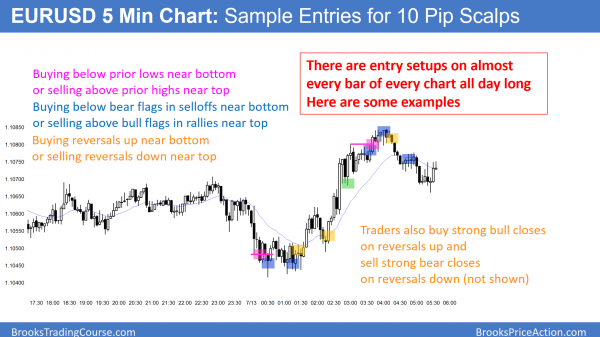
There are entry setups on almost every bar of every chart. I highlighted many on this 5 minute chart of the European session. All were good for 10 pip scalps. Many scalpers will use 20 – 30 point scalps, although they usually exit before their stop is hit. Many will also scale in.
Nothing is different on the daily chart of the EURUSD Forex market. It is still in its month-long trading range after what was probably an exhaustive sell climax. I wrote yesterday about the daily chart of the EURJPY after the June sell climax. The EURUSD had a similar bar, but the context was different. Rather than a bear breakout below a bear channel, the big bear bar formed within a trading range.
Because the daily chart is in a tight trading range, the bulls and bears are equally strong. However, as the result of the tight trading range being near the bottom of a bigger 5 month range, and because of the sell climax 3 weeks ago, the bulls have a slightly greater chance of success. Yet, the probability advantage is small. If it were big, the chart would be in a bull breakout and not a tight range.
Forex scalping
Day traders are scalping for 10 and sometimes 20 pips. This is very difficult for most traders to do profitably, but it is the only way to make money as a day trader when the range is only 40 pips. Why is it difficult? Time. Many traders do not trust the setup as it is forming. By the time they decide to take it, they are too late. The market has already moved several pips, and that makes it difficult to scalp for 10 pips. Moreover, many beginners get frightened if the market goes 10 pips against them. Many experienced traders will add to their position as long as they believe that their initial premise is still valid.
Most trading range breakout attempts fail, so the odds are that the EURUSD Forex chart will work higher over the next week or so. However, it might have one more push down first. That is why it has been in a tight trading range for several weeks. The bulls and bears are balanced, and each is fighting over the direction of the breakout. While the market will eventually break out, in the meantime, EURUSD Forex day traders are continuing to mostly scalp.
Summary of today’s S&P Emini futures price action and what to expect tomorrow
The 60 minute Emini has a wedge top at a measured move target. The rally over the past week is in a tight channel, which is unsustainable and therefore a buy climax. Bulls will take partial profits soon, which should create a 2 – 5 day trading range and a 30 – 40 point pullback.
The Emini reversed down from above yesterday’s high and might be beginning a 20 – 40 point pullback. However, bulls will probably buy the pullback for at least one more test back up.
See the weekly update for a discussion of the price action on the weekly candlestick chart and for what to expect going into next week.
Traders can see the end of the day bar-by-bar price action report by signing up for free at BrooksPriceAction.com. I talk about the detailed S&P Emini futures price action real-time throughout the day in the BrooksPriceAction.com trading room. We offer a 2 day free trial.
When I mention time, it is USA Pacific Standard Time (the Emini day session opens at 6:30 am PST, and closes at 1:15 pm PST). You can read background information on the intraday market reports on the Intraday Market Update page.


Al, hope your appt went well today. Your chat room is really great.
Thanks Al. This chart is a gem.
I have a question regarding expanding triangle. When expanding triangle has completed its 5 legs (e.g. 5mins chart on EUR/JPY) then is it considered to be in a breakout mode? So, generally we should be looking for a breakout in a direction of trend preceding expanding triangle or does this shift the probability back to 50/50?
All triangles are BO mode setups. Sometimes the context is stronger one way or the other and one direction can be 55-60%, but when in doubt, I always assume 50%.