Monthly S&P500 Emini futures candlestick chart:
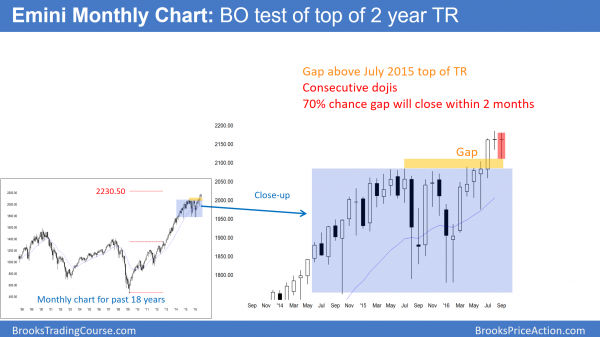
1st time Emini has ever had 8 consecutive bull trend bars so buy climax
The monthly S&P500 Emini futures candlestick chart has one more week before the month closes. It has been staying around the open of the month. If Friday closes above the 2161.75 open of the month, September will be the 8th consecutive bull trend bar on the monthly chart.
Because the monthly S&P 500 candlestick chart is doing something unusual, it is in a buy climax. While there have been several instances of 7 consecutive bull trend bars on the monthly Emini chart in its 18 year history, there has never been 8. Furthermore, every time it has had 7 consecutive bull bars, it soon fell for about 100 points. Therefore, what is more likely? An 8th and maybe even a 9 consecutive bull trend bar? Or, a bear bar, and a 100 point correction within the next month or two? In conclusion, the odds favor a 100 point correction soon, whether or not there is one more new high first.
Weekly S&P500 Emini futures candlestick chart:
Bull channel, but possible wedge top
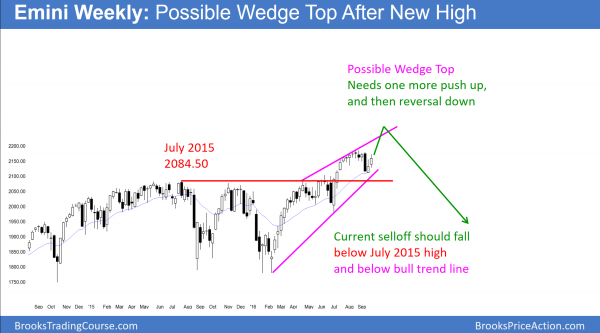
The weekly S&P500 Emini futures candlestick chart reverse up over the past 2 weeks from a test of the top of the 2 year trading range. The momentum is good enough for the bulls to test the all-time high next week.
The weekly S&P500 Emini futures candlestick chart has been in a bull channel since the February low. Yet, the channel has a wedge shape. If the rally continues to a new high, but then reverses, the chart would have a wedge top. Hence, bears will be looking to sell the reversal down.
Wedge top with only 2 legs up?
Sometimes when a pattern is particularly obvious like this, bears begin to sell just below the old high. They do so just in case the Emini forms a lower high instead of a wedge top. If enough bars do this, the 3rd push up does not go above the 2nd top. The reversal therefore becomes a lower high major trend reversal.
While it does not have the 3rd push up and therefore is not a wedge, it if functionally the same as a wedge. This is because the same forces created it. As a result, traders would expect a 10 bar, 2 legged correction.
The bull case
The Emini weekly chart has been in a bull trend since the February low. While the bears have had a couple strong reversal attempts, they lacked conviction. The bulls saw them as bull flags and bought them. The momentum up over the past 2 weeks is strong enough to make a new high likely.
Gap above July 2015 high: Measuring Gap or Exhaustion Gap?
Because the selloff 2 weeks ago failed to drop below the July 2015 high, there is a gap above that high and the low of 2 weeks ago. The bulls expect it to be a Measuring Gap. They therefore are looking for a 300 point rally, based on the height of the 2 year trading range.
When a bull gap occurs after 20 bars in a bull trend, it is more likely an exhaustion gap. This simply means that it will close because of exhausted bulls. It can lead to a reversal, but the minimum goal is a pause in the bull trend.
Because this gap came after 20 bars since the July low, there is a 70% chance it will close soon. While the 2 week reversal up make it a possible measuring gap, the odds are that the rally will fail and the Emini will trade back below the July 2015 high. If it does, the selloff would probably be the start of the 100 point correction that traders expect based on the monthly chart.
Daily S&P500 Emini futures candlestick chart:
stock market island bottom but October correction likely
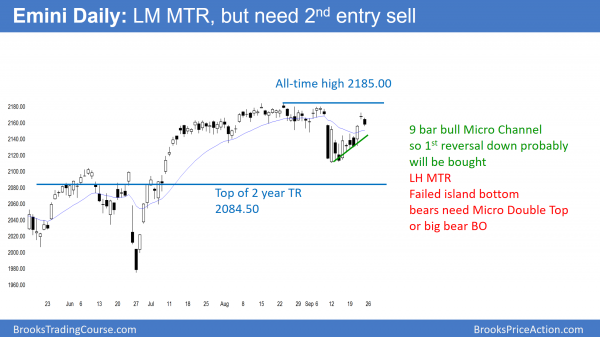
The daily S&P500 Emini futures candlestick chart gapped up 2 days ago and created a 3 week island bottom. While the Emini closed the gap on Friday, the odds still favor follow-through buying next week.
The daily S&P500 Emini futures candlestick chart gapped up Thursday after a gap down 3 weeks earlier. This created an island bottom, which is a sign of strong bulls. Because the Emini reversed up from the strong support at the top of a 2 year trading range, the odds are that the bulls will buy again soon. Therefore, the Emini will probably reach a new all-time high next week. Yet, because of the buy climax on the monthly chart, the odds are that the new high will soon reverse back down.
Possible island top
While the Emini broke above its 2 year trading range, the breakout is still uncertain. It therefore might simply be an expansion of the range. When the Emini is in a range it often forms gaps up or down, and many create island tops or bottoms, or almost island tops or bottoms. This means that traders should be aware that a gap down next week would create an island top. This is true even though Friday closed the gap up by trading below Wednesday’s high. Hence, that would be a sign of strong bears and it would erase the bullishness of this week’s island bottom.
It would also be follow-through after Friday triggered a lower high major trend reversal sell signal. Yet, until there is a strong bear breakout with follow-through selling, the island top is just another reversal in a trading range. It therefore is not important without strong follow-through selling.
Open of the month is a magnet this week
Because the Emini has never had 8 consecutive bull trend bars on the monthly chart, and it is now trading around the open of the month, it might accomplish that when the month closes on Friday. The Emini has traded sideways around the open of the month for 2 days.
This is a sign that traders understand the importance of that price. Hence, this increases the chances that the Emini will trade in a narrow range around the open of the month for the entire week, waiting until the final minutes of the month to decide if September will be the 8th consecutive bull trend bar.
Traders can see the end of the day bar-by-bar price action report by signing up for free at BrooksPriceAction.com. I talk about the detailed Emini price action real-time throughout the day in the BrooksPriceAction.com trading room. We offer a 2 day free trial.
When I mention time, it is USA Pacific Standard Time (the Emini day session opens at 6:30 am PST, and closes at 1:15 pm PST). You can read background information on the intraday market reports on the Intraday Market Update page.


Thanks Al.
I appreciate the elaboration.
I apologize I’m not in the room. I know it’s tedious to repeat things, trust me!
My ES daytrading success rate has gone up exponentially since buying your trading course.
I’ve primarily merged your excellent PA analysis with three setups I used to have some spotty success with. Now they are much more reliable:
1) 30 min OR breakout
2) Trend reversals, but done a little more simply than your retest method (though it’s probably about the same)
3) Consolidation breakouts
My primary income comes from selling SPX PUT premium but this is slow, methodical, boring and there are long swaths of doing absolutely nothing. So daytrading the ES keeps me engaged with the market and I find it fun and challenging.
Anyway, I really appreciate all that you are doing for us hacks out here!
Take care,
Rob in Atlanta
Al,
Thank you for the excellent explanation of the monthly, weekly, and daily charts. It is the highlight of my week to read your comments.
If we get this 100 point drop, what happens after that?
I have talked about this in the room many times. The stock market is probably putting in a major top, which might take 2 years to complete. For example, it could fall back to the bottom of the 2 year range, and then rally to a right shoulder. That could take 20 or more bars on the monthly chart, which is about 2 years.
It never tested the breakout about the 1500 double top, which is a measured move below the 2 year range. That is therefore a reasonable target several years from now. However, if it corrects to and bases around 1800 several years from now, that could be the bottom forever.