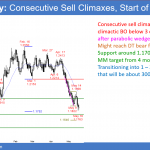
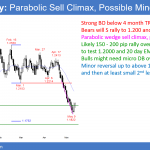
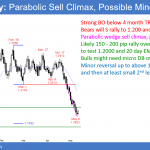
Emini bears want outside down candle stick on weekly chart I will update again at the end of the day Pre-Open market analysis Yesterday reversed down from a breakout above last week’s high. It sold off strongly at the end of the day and formed an outside down day. Since last week was small, the […]
Market Update Report for the S&P500 Emini (ES) will be available to logged-in Brooks Trading Course members within 1-2 hours after US market open each day. The update will be available to everyone, including visitors, about 2 hours or more after market open.
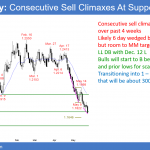
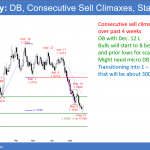
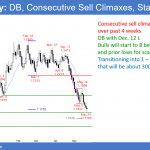
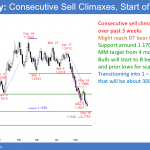
Emini bears want outside down candle stick on weekly chart
Emini trend resumption up, but possible small double top
Intraday market update: May 22, 2018
Emini trend resumption up, but possible small double top I will update again at the end of the day Pre-Open market analysis The Emini gapped up yesterday and entered a trading range after a 50% pullback. The odds favor a breakout above last week’s high this week. Because yesterday gapped up and was a small […]
Emini weak breakout above 3 month triangle bull flag
Intraday market update: May 21, 2018
Emini weak breakout above 3 month triangle bull flag I will update again at the end of the day Pre-Open market analysis The Emini broke above the April 18 major lower high, but pulled back. The odds are that the bull trend will resume this week. This means that the 4 sideways days are more […]
Emini sell signal bar but minor reversal in bull flag
Intraday market update: May 18, 2018
Emini sell signal bar but minor reversal in bull flag I will update again at the end of the day Pre-Open market analysis Yesterday was a bear reversal day. The odds are that the Emini daily chart is still forming a bull flag. However, if the bears get a couple big bear days, the odds […]
Emini weak buy signal yesterday and back above April high
Intraday market update: May 17, 2018
Emini weak buy signal yesterday and back above April high I will update again at the end of the day Pre-Open market analysis The Emini rallied in a trending trading range day yesterday. It was the 2nd day in a bull flag on the daily chart. The odds are that the daily chart will go […]
Emini sell signal and test of 2700 big round number
Intraday market update: May 16, 2018
Emini sell signal and test of 2700 big round number I will update again at the end of the day Pre-Open market analysis The Emini gapped down and triggered a sell signal on the daily chart yesterday. Since yesterday was not a big bear day, it was not a strong sell entry bar. Because yesterday […]
Emini rally hesitating at April high during Israel embassy crisis
Intraday market update: May 15, 2018
Emini rally hesitating at April high during Israel embassy crisis I will update again at the end of the day Pre-Open market analysis The Emini daily chart had an 8 bar rally with shrinking bull bodies for 4 days. The odds were that yesterday would not be a bull trend day. It was a trading […]
Emini pullback from breakout above April high and triangle
Intraday market update: May 14, 2018
Emini pullback from breakout above April high and triangle I will update again at the end of the day Pre-Open market analysis The Emini 5 minute chart reversed down on Friday after breaking above the April high. When there is a breakout on the daily chart, the Emini often goes sideways for a few days […]
Emini triggered monthly buy signal on breakout above April high
Intraday market update: May 11, 2018
Emini triggered monthly buy signal on breakout above April high I will update again at the end of the day Pre-Open market analysis The Emini rallied strongly yesterday and traded above the April high. This triggered a buy signal on the monthly chart. However, after 3 days in a bull channel on the 5 minute […]
Emini buy signal and test of 2700 big round number
Intraday market update: May 10, 2018
Emini buy signal and test of 2700 big round number I will update again at the end of the day Pre-Open market analysis The Emini triggered buy signals on the daily and weekly charts yesterday. It was in a small pullback bull trend, and it tested the 2700 Big Round Number. The rally will probably […]

