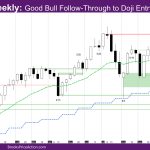
Market Overview: NASDAQ 100 Emini Futures The NASDAQ Emini futures week is a good bull follow-through to doji entry bar of 11-25. On the daily chart, the market is accelerating up from the exponential moving average (EMA). Three of the five days were non-climactic bull trend bars although with bad follow-through. The month is already […]
Nasdaq 100 November Is New All-Time High Close
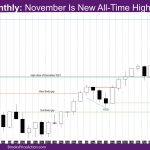
Market Overview: NASDAQ 100 Emini Futures The NASDAQ Emini futures November monthly candlestick is a bull trend bar with a prominent tail above. November is new all-time high close of the year. The week is a doji bull bar with a longer tail below. It is a short trading week. It went above the high of […]
Nasdaq 100 Bad Follow-Through to Big Bear Bar of 11-11
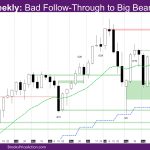
Market Overview: NASDAQ 100 Emini Futures The NASDAQ Emini futures week is a good bull reversal bar and a bad follow-through to big bear bar of 11-11. On the daily chart, the market went sideways to up all week to get back above the exponential moving average (EMA). The monthly bar is now a bull […]
Nasdaq 100 Breakout Failure of All-Time High
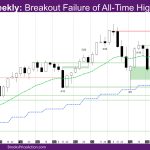
Market Overview: NASDAQ 100 Emini Futures The NASDAQ Emini futures week is a bear trend bar mostly reversing the big bull bar of last week. It signifies a breakout failure of all-time high. On the daily chart, the market went sideways for a few days early in the week and then had bear trend days […]
Nasdaq 100 Bull Breakout to New All-Time High Close
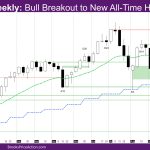
Market Overview: NASDAQ 100 Emini Futures The NASDAQ Emini futures week is a surprise bull breakout to new all-time high close, just above the prior all-time high. On the daily chart, the market had a big bull breakout of the exponential moving average (EMA) on Wednesday with good follow-through on Thursday after the election results. […]
Nasdaq 100 L2 Sell Signal Bar That Will Likely Trigger
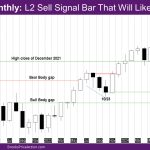
Market Overview: NASDAQ 100 Emini Futures The NASDAQ Emini futures October monthly candlestick is a bear doji bar with a longer tail above. It is an L2 sell signal bar that will likely trigger. The week is an outside down bear bar with tails above and below. It went above the high of last week and […]
Nasdaq 100 End of Weak Third Leg up From 8-5
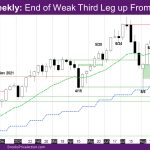
Market Overview: NASDAQ 100 Emini Futures The NASDAQ Emini futures week is a doji outside bar with a close around the open. It represents the end of weak third leg up from 8-5. On the daily chart, the bull channel phase above the exponential moving average (EMA) is weakening, with doji bars and bars with […]
Nasdaq 100 Weak Third Leg up From 8-5
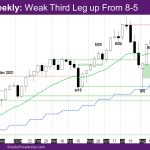
Market Overview: NASDAQ 100 Emini Futures The NASDAQ Emini futures week is a doji bull bar with a close around the middle of the bar. It represents a weak third leg up from 8-5. On the daily chart, the market continues its bull channel phase above the exponential moving average (EMA). The month is a […]
Nasdaq 100 Third Leg up From 8-5
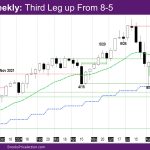
Market Overview: NASDAQ 100 Emini Futures The NASDAQ Emini futures week is a bull bar with a tail below. It represents the third leg up from 8-5. On the daily chart, the market continues its bull channel phase above the exponential moving average (EMA). NASDAQ 100 Emini futures The Weekly NASDAQ chart The Daily NASDAQ […]
Nasdaq 100 August Bad H1 Buy Signal Triggered
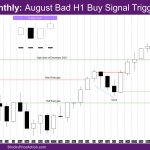
Market Overview: NASDAQ 100 Emini Futures The NASDAQ Emini futures September monthly candlestick is another bull doji bar with a long tail below. The August bad H1 buy signal triggered, and the market closed just below the August high. The week is a bear doji bar with a bigger tail below. It pulled back below last […]


