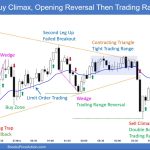
Trading Update: Monday November 27, 2023 S&P Emini pre-open market analysis Emini daily chart Emini 5-minute chart and what to expect today Emini intraday market update Pre-Thanksgiving Emini setups Richard created the SP500 Emini chart (Al on Thanksgiving leave). Here are reasonable stop entry setups from Wednesday before Thanksgiving break. I show each buy entry […]
If you are not seeing the latest Weekly Report below, your PC/device browser is likely showing you an earlier page copy. Simply refresh your browser. For PCs you can use the F5 key, or Ctrl-F5, several times if needed.
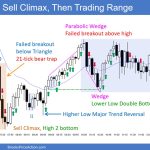
Emini Follow-through Bull Bar
Market Overview: S&P 500 Emini Futures The weekly chart formed an Emini follow-through bull bar following the breakout above the bear trend line. The next target for the bulls is the July 27 high. The bears want a reversal from a lower high major trend reversal or a double top with either the September 1 […]
Crude Oil Higher Low MTR (Major Trend Reversal)?
Market Overview: Crude Oil Futures The bulls want a Crude Oil higher low MTR (Major Trend Reversal) on the weekly chart. They want a larger second leg up lasting many weeks, with the first leg being the move-up from June to September. The bears hope that the bear leg to retest the May low has […]
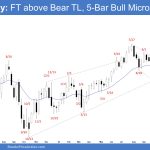
EURUSD Follow-through Bull Bar
Market Overview: EURUSD Forex The weekly chart formed a EURUSD follow-through bull bar following last week’s close above the 20-week EMA. The bulls want a retest and breakout above the trading range high (April/May highs). The bears want a reversal from a wedge bear flag (Oct 12, Nov 3, and Nov 21) and a lower […]
Bitcoin 7-week Bull Micro Channel at Measured Move
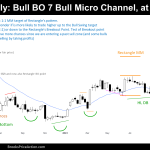
Market Overview: Bitcoin Futures Bitcoin futures 7-week Bull Micro Channel at Measured Move. The price concluded another week with a low above the prior low, a 7-week streak. By the end of the upcoming week, there will also be the monthly close. Traders expect a test of $37000 during the week, which is the middle […]
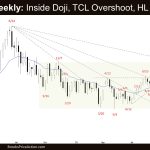
Nifty 50 Inside Bar Measured Move
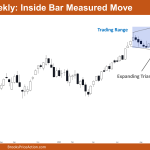
Market Overview: Nifty 50 Futures Nifty 50 Inside Bar Measured Move on the weekly chart. This week, the market gave a small bull close, and it is currently trading within the expanding triangle and the trading range. The market is moving closer to the inside bar measured move after the weekly chart of the Nifty […]
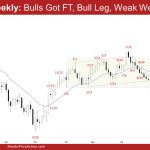
FTSE 100 Breakout Pullback, Small Gap at MA
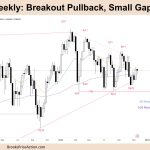
Market Overview: FTSE 100 Futures FTSE 100 futures went higher last week with a breakout and a pullback, creating a small gap. The pattern is fractal, doing the same thing on the lower timeframe, the daily chart. Traders are deciding if we are swinging up or down. Because bears and bulls are still in, scalpers […]
DAX 40 Breakout Follow-through With MC BO Gap
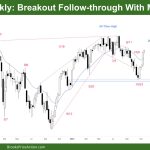
Market Overview: DAX 40 Futures DAX futures continued up last week with a breakout follow-through, creating a microchannel (MC) with a breakout gap (BO Gap.) We are always in long, so traders should be long or flat. Now we have a small signal bar – small risk. That increases the chance of a test above […]
Nasdaq 100 High above July 2023 High
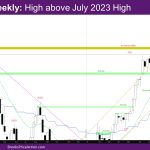
Market Overview: NASDAQ 100 Emini Futures The NASDAQ Emini futures week is the short 2023 Thanksgiving trading week. It’s a bull bar with a prominent tail at the top and a high above July 2023 high. On the daily chart, Monday was a good bull bar going above the July high, and the rest of […]
Emini Far from Moving Average
Trading Update: Wednesday November 22, 2023 S&P Emini pre-open market analysis Emini daily chart Emini 5-minute chart and what to expect today Emini intraday market update Yesterday’s Emini setups Al created the SP500 Emini chart. Here are reasonable stop entry setups from yesterday. I show each buy entry bar with a green arrow and each […]

