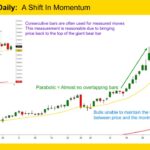
Gold GC-Mini Market Analysis The Gold GC-mini after testing a record peak has spent this past week in a tumultuous correction, showing that even the strongest bull trends need to “reset”. The Daily GC mini chart shows a classic scenario of an extreme parabolic wedge top, a deep retracement, and now, a market struggling to […]
If you are not seeing the latest Weekly Report below, your PC/device browser is likely showing you an earlier page copy. Simply refresh your browser. For PCs you can use the F5 key, or Ctrl-F5, several times if needed.
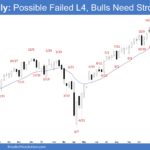
Nasdaq 100 Bear Inside Bar Following Biggest Bar Since April 2025
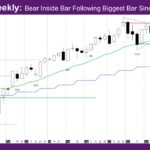
Market Overview: NASDAQ 100 E-mini Futures The NASDAQ E-mini futures week is a bear inside bar following biggest bar since April 2025. It is also the first bar since April 2025 with body completely below the weekly exponential moving average (EMA) The daily chart had a second leg down from around the weekly/daily EMA. NASDAQ […]
E-mini Volatile Open, Bull Channel Then Midday Reversal
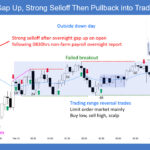
Trading Update: Friday February 13, 2026 S&P E-mini market analysis Yesterday’s E-mini setups Richard created the SP500 E-mini chart. Here are reasonable stop entry setups from yesterday. Chart shows each buy entry bar with a green arrow and each sell entry bar with a red arrow. Buyers of the Brooks Trading Course have access to […]
E-mini Bears Getting Reversal Down
Trading Update: Thursday February 12, 2026 S&P E-mini market analysis E-mini daily chart E-mini 5-minute chart and what to expect today Yesterday’s E-mini setups Richard created the SP500 E-mini chart. Here are reasonable stop entry setups from yesterday. Chart shows each buy entry bar with a green arrow and each sell entry bar with a […]
E-mini Disappointment for the Bulls
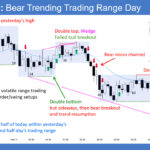
Trading Update: Wednesday February 11, 2026 S&P E-mini market analysis E-mini daily chart E-mini 5-minute chart and what to expect today Yesterday’s E-mini setups Richard created the SP500 E-mini chart. Here are reasonable stop entry setups from yesterday. Chart shows each buy entry bar with a green arrow and each sell entry bar with a […]
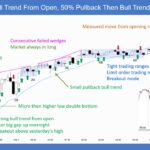
E-mini Bulls Want Breakout Above All-Time High
Trading Update: Tuesday February 10, 2026 E-mini end of day video review Follow Joseph’s YouTube channel for more Al Brooks price action analysis. S&P E-mini market analysis E-mini daily chart E-mini 5-minute chart and what to expect today Yesterday’s E-mini setups Richard created the SP500 E-mini chart. Here are reasonable stop entry setups from yesterday. […]
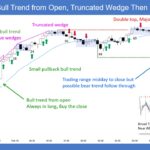
E-mini Bulls Hopeful for Strong Follow-through
Trading Update: Monday February 9, 2026 E-mini end of day video review Follow Joseph’s YouTube channel for more Al Brooks price action analysis. S&P E-mini market analysis E-mini daily chart E-mini 5-minute chart and what to expect today Yesterday’s E-mini setups Richard created the SP500 E-mini chart. Here are reasonable stop entry setups from yesterday. […]
Weekly E-mini Tight Trading Range
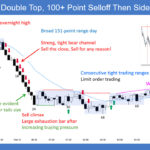
Market Overview: S&P 500 E-mini Futures The market is in a weekly E-mini tight trading range near the all-time high. Bears need more follow-through selling closing below the 20-week EMA to flip the market into Always In Short. Bulls need a strong breakout with sustained follow-through buying above the January 28 high to increase the […]
Crude Oil Overlapping Inside Bar
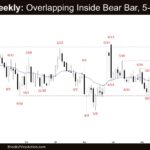
Market Overview: Crude Oil Futures The weekly chart formed a Crude oil overlapping inside bar around the middle of the trading range. Bears want a reversal from a double top bear flag (September 26 and January 29). Bulls see this week as a pullback and want at least a small sideways-to-up leg to retest the […]
Weekly EURUSD Bears Need Follow-through Selling
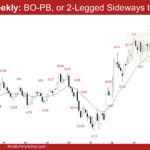
Market Overview: EURUSD Forex The weekly EURUSD bears need follow-through selling to increase the odds of a 2-legged sideways to down pullback. Bulls see the current move as a breakout pullback test of the December 24 high. They want the pullback to be weak and sideways, with overlapping candlesticks, long tails below bars, and prominent […]

