Market Overview: Bitcoin Bitcoin The Weekly chart of Bitcoin The Daily chart of Bitcoin Market analysis reports archive You can access all the weekend reports on the Market Analysis page.
If you are not seeing the latest Weekly Report below, your PC/device browser is likely showing you an earlier page copy. Simply refresh your browser. For PCs you can use the F5 key, or Ctrl-F5, several times if needed.
Nifty 50 Wedge Top
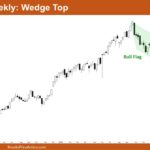
Market Overview: Nifty 50 Futures Nifty 50 Wedge Top on the weekly chart. The market closed strongly bullish this week and is now trading near the top of the wedge top pattern. It is currently forming the second leg up after a strong bullish move. The Nifty 50 is still about 1000 points away from […]
Nasdaq 100 Bull Breakout Closing Far Above Ema
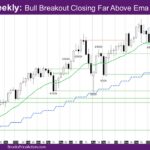
Market Overview: NASDAQ 100 Emini Futures The NASDAQ Emini futures week is a bull breakout closing far above EMA – exponential moving average. This is the best booking breakout of the EMA in the recent past and bulls now need a good follow-through bar. The daily chart started the week with a strong bull breakout […]
Emini Outside Bar Likely to Get Bad Follow-Through
Trading Update: Friday May 16, 2025 S&P Emini market analysis Emini daily chart Emini 5-minute chart and what to expect today Yesterday’s Emini setups Al created the SP500 Emini charts. Here are reasonable stop entry setups from yesterday. I show each buy entry bar with a green arrow and each sell entry bar with a […]
Emini Limited Upside without Deeper Pullback
Trading Update: Thursday May 15, 2025 Emini end of day video review S&P Emini market analysis Emini daily chart Emini 5-minute chart and what to expect today Yesterday’s Emini setups Al created the SP500 Emini charts. Here are reasonable stop entry setups from yesterday. I show each buy entry bar with a green arrow and […]
Emini Pullback to Moving Average Likely
Trading Update: Wednesday May 14, 2025 Emini end of day video review Follow Joseph’s YouTube channel for more Al Brooks price action analysis. S&P Emini market analysis Emini daily chart Emini 5-minute chart and what to expect today Yesterday’s Emini setups Al created the SP500 Emini charts. Here are reasonable stop entry setups from yesterday. […]
Emini 6,000 Round Number is in Reach
Trading Update: Tuesday May 13, 2025 Emini end of day video review S&P Emini market analysis Emini daily chart Emini 5-minute chart and what to expect today Yesterday’s Emini setups Al created the SP500 Emini charts. Here are reasonable stop entry setups from yesterday. I show each buy entry bar with a green arrow and […]
Emini Climactic Rally on Daily Chart
Trading Update: Monday May 12, 2025 Emini end of day video review Follow Joseph’s YouTube channel for more Al Brooks price action analysis. S&P Emini market analysis Emini daily chart Emini 5-minute chart and what to expect today Friday’s Emini setups Al created the SP500 Emini charts. Here are reasonable stop entry setups from Friday. […]
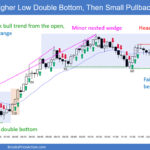
Weekly Strong Emini Pullback
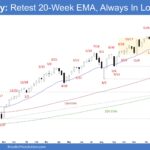
Market Overview: S&P 500 Emini Futures The market formed a weekly strong Emini pullback testing the 20-week EMA. If there is a pullback, the bulls want it to be minor, forming a double bottom bull flag (and a higher low) with the April 21 low. The bears They want the 20-week EMA or the March […]
Weekly Crude Oil Higher Low
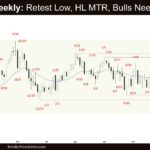
Market Overview: Crude Oil Futures The market formed a weekly Crude Oil higher low this week. The bulls want a reversal from a higher low major trend reversal (May 5) and a wedge pattern (Mar 5, Apr 9, and Mar 5). If the market trades higher, the bears want it to form a double top […]

