A five-minute E-mini S&P 500 chart provides an incredible amount of information. But despite this massive flow of information, simple analysis of its price action is all that is needed to trade successfully. One such strategy is based on flag formations, and a final flag usually presents several profitable entries every day.
A flag formation occurs when the market forms an area of congestion following a surge of activity. This indicates that both buyers and sellers are equally active at the current price. If the previous surge was upward, the breakout will usually be to the upside. However, if the flag extended far enough to break an up trendline, then buyers will be wary because this is a sign that the momentum is waning. Many bulls will scalp out with a small profit on the breakout to the new swing high. Also, bears will look for another opportunity to sell at the slightly better price that the new high offers. This often leads to a reversal that may be either a scalping opportunity or the start of a protracted downswing. In either case, it is a low-risk, high-probability entry.
One of the most reliable entry methods is on a stop at one tick beyond the prior bar. If the market is in a bull flag and you are looking to buy, place a buy stop order one tick above the high of the prior bar. If by the time the current bar is complete, the bar does not extend beyond the high of the prior bar, lower the buy stop to one tick above the current bar that just completed itself. (Do the opposite when trying to sell a breakout from a bear flag; enter it on a sell stop at one tick below the low of the prior bar).
On a five-minute E-mini S&P 500 chart, if you picked your entry correctly, an initial four-tick protective stop works in more than 80% of the breakouts. If the bars are large or the flag looks like it has more to go, either risk six ticks or, even better, wait for a second entry.
Waiting for a second entry means that you do not take the initial trade. Instead of buying the breakout of the high of the prior bar, wait to see if the bar after the breakout has a lower high. If it does, place an order to buy one tick above its high. (This move represents the second attempt at a bull breakout.)

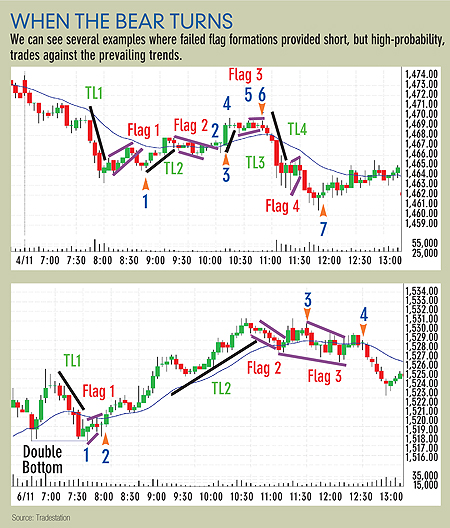
In the first chart in “When the bear turns” (above), TL1 is a steep down trendline that is broken by Flag 1. In general, fading a strong trend is a losing proposition. However, in this particular case, there were three large bear bars and the previous two had decent tails; thus, the bears might be temporarily exhausted. Also, because the downward trend bars did not close within a couple ticks of their lows, the sellers are showing that they are not as aggressive as they could be.
The next bar is a small bull reversal bar, with its low below the prior bar’s low, and a close above the open and above the close of the prior bar. This is a mark of buying. Also, four of the five bars of the bear flag had closes above their opens, again indicating that buyers are active. Once the bear flag broke to the downside, the breakout bar was not large. The next bar was even smaller and its close was near its high. All of this increases the odds that there will be at least a second leg up (the bear flag being the first leg up).
This is a low-risk long entry and it has a high probability of extending at least six ticks. A six-tick breakout is a magical number for E-mini day traders. Many traders scalp for four ticks and to do so, the move has to extend six ticks. Why do you need a six-tick move to make four ticks? You enter on a stop that is one tick above the prior bar, and you are trying to exit at four ticks above that. Most of the time, a sell limit order will not be filled unless the market goes above it by at least one tick, meaning that a six-tick move is required to net four ticks on a scalp.
Market turns
When trading counter trend, it is natural to be hopeful that the trend has reversed and that your trade will make a fortune. The reality is that you just bought a bear trend and the odds are high that the bear trend will resume. As such, it is wise to take profit on most of your position after just a small up-move.
For example, if you bought three contracts, you might take profit on two at four ticks (that is, scalp when trading counter trend). Then, place a protective stop at breakeven on the remaining contract. If a sell signal develops in the meantime, take the sell signal and exit your remaining long at the same time. If it turns out that you did just buy the low of the next 10 years and you are angry for taking a scalper’s profit instead of holding on for a fortune, remember that every strong trend will have plenty of great entries that you can swing for more profits. Also, it is important to maintain discipline. This is a strategy to take advantage of short-term corrections and it should be treated as such.
This second leg of the up-move in the first chart in “When the bear turns” formed a bull flag (Flag 2). There was a small breakout bar (Bar 2) that failed on the next bar, which had a low below the low of the breakout bar. You don’t want to buy the breakout because it follows several small bars that closed near their open, which indicates indecision. When bars are small and closes are near the opens, a better play is to watch for an entry, don’t take it and then wait for it to fail and trap one side; enter as the trapped traders are forced to reverse.
In this example, most bulls would not have bought at Bar 2 because of the small sideways bars that made up the flag. Likewise, bears would be hesitant to sell on the bar after Bar 2 when the bull breakout failed, because there was not enough up momentum to trap many longs. However, when the market made a second breakout to the upside at Bar 3, this is a great long entry, again only for a scalp because there is no evidence that the market is in a bull swing.
Flag 3 had two bull breakouts and both failed. Again, the bars in the flag were tiny, indicating lack of conviction. However, this second failure of the bull flag breakout is a great short (a second entry is almost always a good trade), especially because the down momentum of the first 90 minutes of the day was so strong. Also, three legs up in a bear often works like a wedge, resulting in a new low.
Flag 4 broke a steep trendline and reversed the low of earlier in the day (two of the bars in the flag were above the highs of the prior bar). When the market reversed upward again at Bar 7, it was the second attempt to reverse after a new low of the day and it also followed a bear flag breakout. Also, both the flag and the new low had lots of tails and the closes were above the opens, indicating that buyers were coming into the market by the time the bars closed. This makes a long at Bar 7 a high probability long scalp.
The second chart in “When the bear turns” shows a bear trendline (TL1) followed by a small, two-bar bear flag that broke the trendline. There was a bear breakout that failed on the next bar, which was a great long entry. What made this particularly strong was that the low of this leg was exactly at the low price of the opening range, creating a double bottom. Also, the range of the day at this point was only about six points and the average range had been more than 10 points, indicating that there would likely be a breakout of the range either up or down.
Because the market made an exact test of the low followed by a bear flag breakout, creating another attempt at a breakout into a bear swing and a measured move down, and both attempts failed, there was a great chance that the market would attempt an upside breakout. When an entry has a reasonable chance of being the low (or high) of the day, it is best to scalp out only part and let most of your trade swing. For example, if you traded three contracts, you might scalp one at four ticks and hold the other two with a breakeven stop.
The market formed an extended bull move to a new high, but Flag 2 broke below the bull trendline (TL2). After the bull flag breakout, Bar 3 traded below the low of the prior bar, providing a short entry. This entry is against a strong trend, so you should scalp all or most of your trade. The market formed a larger bull flag (Flag 3), which was a well-shaped bull flag on higher timeframe charts (such as the 15-minute chart). Bar 3 was a short entry below the low of the prior bar, creating a failed bull flag breakout.

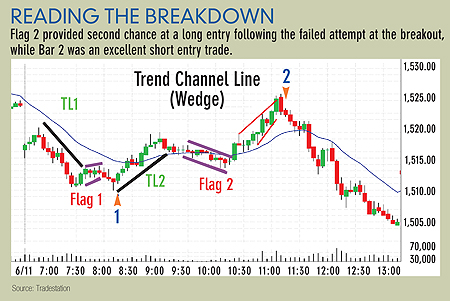
More examples of these formations are shown in “Reading the breakdown” (above). It shows a powerful failed flag at Bar 1, which was a possible low of the day (every new low is a possible low of the day). Flag 2 was protracted and broke below a bull trendline (TL2). There was a large breakout bar that failed on the following bar. The breakout was so strong and the prior up move so convincing that you should not be looking to short here (wait for a second sell signal). This failure became just a test of the breakout (a failed attempt at a failed breakout), and was a great second-chance long entry.
Bar 2 was a wonderful short entry. The bull poked above a bull trend channel line and reversed back down, indicating exhaustion. The move had three thrusts up, making it a wedge. The move was basically a measured move up that tested yesterday’s close and immediately reversed down. The entry bar was a second entry (remember the first entry that occurred on the bar after the breakout?). A climactic move usually results in an extended move in the opposite direction. This is a great short and you should swing most of your shorts, expecting at least an hour or so down and usually at least two clear legs (here, there was just one extended leg).
Going with the flow
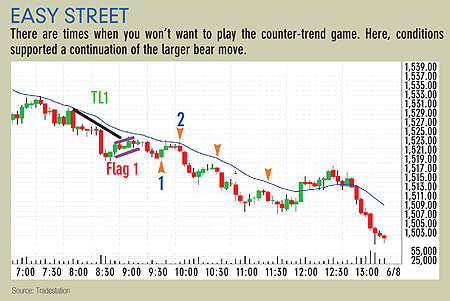
“Easy street” shows when you should stick with the trend. Bear Flag 1 broke the down trendline (TL1), providing a great long scalp at Bar 1. Because it is a counter trend, you should scalp most or all of your contracts. If you hold some, you would exit the balance at breakeven. Following the long entry, there was a bar that poked above the 20-period exponential moving average (EMA) but closed below its midpoint, indicating that the bears won the bar.

Bar 2 was a second attempt at crossing above the 20-period EMA, and this time the bar closed near its low and the range was larger than that of the prior EMA test bar, showing that the bears were now even more aggressive. Also, this leg up had a lower high than the high of Flag 1 (a bear trend has lower lows and highs). Finally, this was the first touch of the 20-period EMA in a couple hours, indicating that the bears have been aggressive all day.
When you see this much bear strength, you need to start looking for bull set-ups. The reason is each will be seen as a possible low of the day, month or even year by lots of generous traders who will buy, lifting the market for only a few ticks. When no strong bull bar forms after their entry, they will feel trapped with no profit and likely a one- or two-tick loss that never seems to go away. They will place their sell stops to exit at one tick below the low of the prior bar. They will exit at a loss and not be eager to buy again until the next small up-close bar forms.
The most reliable trading opportunities always occur when someone is trapped. Each of these small long set-ups saw weak bulls trapped with losses, with their protective stops providing the perfect area to get short, at one tick below the low of the prior bar. Because you are trading with the trend, you should swing most of your contracts because a trend will always extend much further than anyone thinks it should.
This is based on an article from the January 01, 2008 issue of Futures magazine.