Whenever a trader begins his quest to learn how to make money, he naturally looks for information. Ads and websites are reasonable resources. He will invariably find many that are extremely professional and showcase lots of technical analysis indicators. He then concludes that complicated computer screens with lots of quote screens and charts filled with indicators are an inescapable necessity.
However, if he instead listens to professional traders on television, he never hears anything about indicators. Instead, he only hears about the market testing its old highs or a trend line. How could these traders ever be making money without all of those indicators? Because most profitable traders have a relatively simple approach. And, it is almost always based on reading price action. They look for support and resistance and watch how the market responds when it gets there.
The importance of support and resistance
During a strong bull breakout, they simply buy at the market and hold until the market gets to resistance, where they take partial or full profits. During a strong bear breakout, they take profits at support.
Beginners are naturally afraid and are looking for protection. They look to gurus and indicators, hoping that these gods will protective them from trading death and lead them to nirvana. What they soon learn is that they still lose money, even when they do exactly what their false gods tell them to do.
How can that be? The experts on television look rich and must be great traders. The technical analysis indicators in the ads must surely be what the professionals use. What they do not realize is that trading is much simpler and the key to success comes from within. Traders simply have to spend a lot of time learning how to find support and resistance and how to structure and manage trades. Everything else is a lie.
Do not get addicted to technical analysis indicators
I have never met any successful trader who makes his trading decisions based on lots of charts covered with technical analysis indicators. I believe that the exact opposite is true. Indicators are all derived from price. If you can read price action, why add all of those indicators that only obscure the charts and give you the false hope that they will somehow help you trade better? You are simply trying to find a crutch that you hope will support you until you finally become profitable.
Successful traders take responsibility for their decisions. They do not look for a powerful outside force like a mystical indicator or a trading guru to guide them to financial heaven.
Indicators are a bad crutch
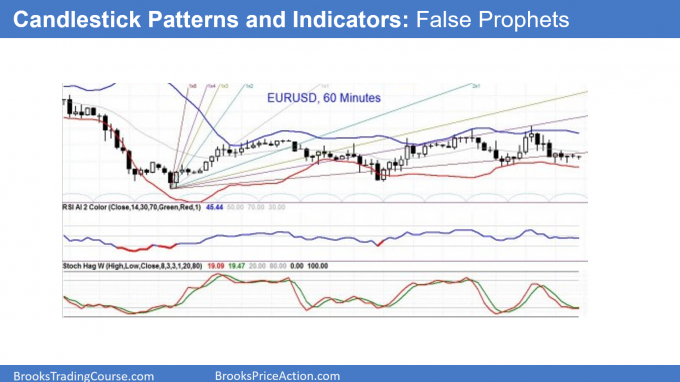
Look at the two charts below. The first one looks like it could be in an ad. Lots of colorful indicators, but they make it very difficult to see what you are actually trying to trade. That is the price!
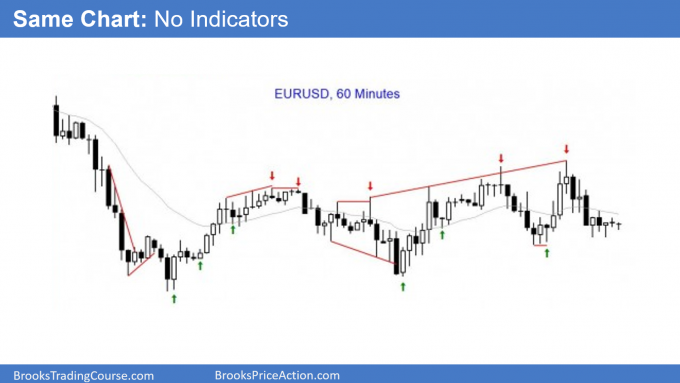
The second one is the same chart, but without indicators except for a 20 bar exponential moving average. Even that is not necessary to trade profitably. I use it because it acts as support and resistance and therefore provides several trades that might not otherwise be evident. This simple chart is how I look at charts when I trade, and most successful traders use something similar.

Ads and websites want you to believe that you can get rich if you trade a chart that has lots of indicators. More information, more money!

Experts focus on price action
Some traders might use tick or volume charts, or one or two indicators, but they all make most of their decisions based on price action. They want to buy at support and sell at resistance.
The best traders are extremely good at understanding the many forms that support and resistance take and how tests look when they are likely to be successful. The stronger the buying pressure (I will discuss this in a later article), the more likely the market will go up. This is true whether it has pulled back to support or rallied to resistance. The stronger the selling pressure, the more likely it will go down.
Price is truth
Look at the two charts above and decide which one is more likely going to lead to a profitable trade. One has lots of technical analysis indicators that make the chart extremely difficult to read. Beginners gravitate to charts like that because they are afraid of price. Also, they get constant messages from websites and magazine ads that implicitly tell them that adding lots of indicators will give them the edge needed to beat the other guy.
They know that price is truth and that they cannot yet make money. Hiding the price action is a way of denying the truth, as you will discover as you learn how to trade.
Price action traders prefer the second chart. The signals are clear, but it takes a long time to develop the skill to read the chart as it unfolds and then manage the trade appropriately. There is nothing magical. Learning how to trade successfully is actually quite boring most of the time, but I personally find the waiting to be very peaceful.
Thank you for reading my How To Trade Price Action manual.
The next article is Trading Ranges.
Complete list of links for all How to Trade Price Action Manual chapters.
Thank you for everything you have done for us. Your work is a life changer for many many many traders, sir. I can’t express how grateful I’m in these worlds. Regrets from Brazil!
Changed my trading style after going through this course . it really helped to show my weakness and where i am failing .. Thanks Al
bought your PA course is one the best decision I ever made in my life sir.
There was no better way to express it than in this comment. This insight is the holy grail. Tks vm Al. Best regards from Germany