Trading Update: Tuesday July 14, 2026
S&P E-mini market analysis
E-mini daily chart
- The daily chart of the E-mini continues to form a triangle and has gone sideways for the past several weeks.
- At the moment, the odds favor a test of the June 15th high, which is the most recent lower high.
- The bears are hopeful that the market will form a double top and a lower high major trend reversal with the June 15th high, but the odds are against it.
- More likely, the market will test up to the all-time high and the 7,700 round number.
- Because of all the sideways trading, the probability is close to 50-50 for both the bulls and the bears.
- However, with the higher time frames being bullish, the triangle is more likely a bull flag that will lead to an upside breakout rather than the start of a major trend reversal.
- Even if the market sells off to 7,300 and below the June low, there will likely be buyers not far below it.
E-mini 5-minute chart and what to expect today
- The E-mini gapped up on the open and formed a doji bar with bar 1, and then bar 2 formed an outside bar.
- This was a sign that today was going to have a lot of sideways trading.
- The market went sideways for the first 12 bars and then formed a climactic bull breakout on bar 13 with a tail above.
- Because of the tail on bar 13, the upside potential was limited and the risk of a trading range increased.
- The bulls found buyers below bar 15 and got a second leg up on bars 19 and 20.
- However, because of bar 13, there were likely sellers in the upper third of that bar, and that led to sellers around the bar 21 high.
- The bears ended up selling off to the bar 33 low, where the market formed a parabolic wedge and found buyers.
- As of bar 48, there was a large upside breakout around 9:00 a.m. Eastern Time that tested 7,612.
- It is possible that the market may have to rally back up to that price level before the end of the day.
- So far, as of bar 47, the channel up from the bar 33 low is tight enough that there are likely buyers on the first reversal down and at the moving average.
- The bears will probably need to make the market go sideways for more bars if they are going to get a credible shot at a reversal down.
- We’ll see you next week.
Yesterday’s E-mini setups
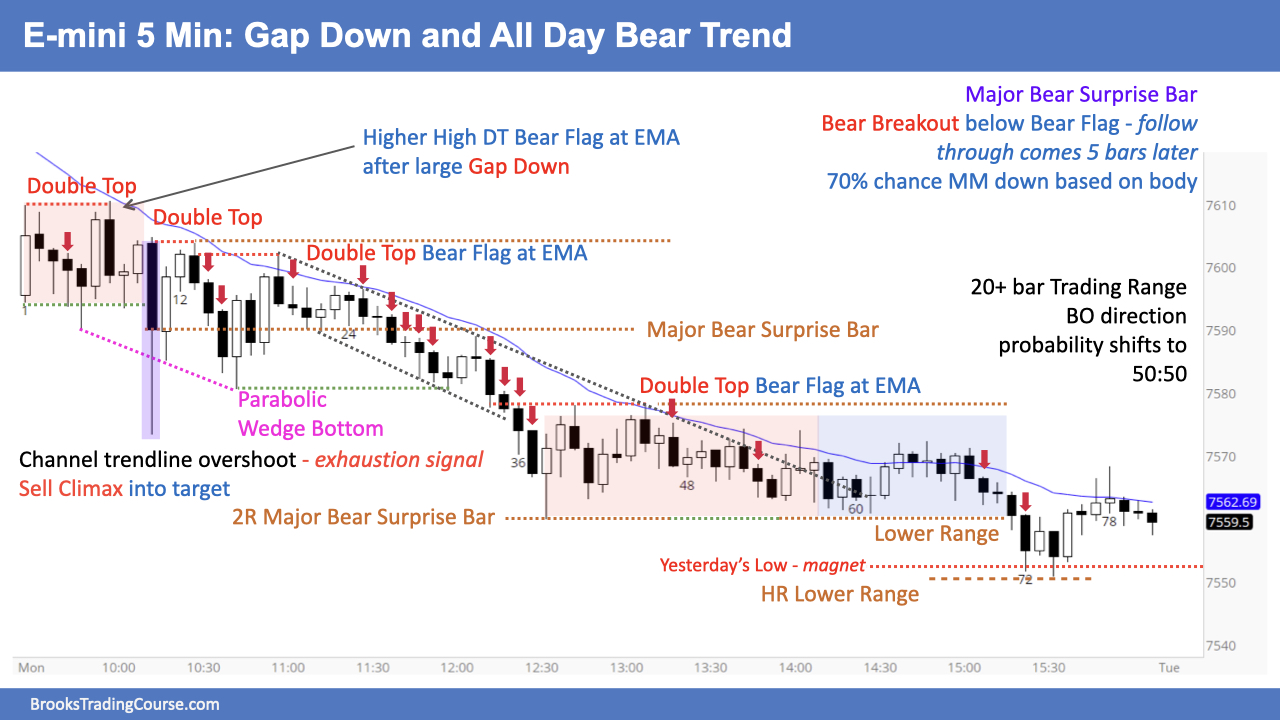
Jed created the SP500 E-mini chart.
Here are reasonable stop entry setups from yesterday. Chart shows each buy entry bar with a green arrow and each sell entry bar with a red arrow. Buyers of the Brooks Trading Course have access to a near 4-year library of detailed explanations of swing trade setups (see Online Course/BTC Daily Setups) linked to the Brooks Encyclopedia of Chart Patterns product.
The goal with these charts is to present an Always In perspective. If a trader was trying to be Always In or nearly Always In a position all day, and he was not currently in the market, these entries would be logical times for him to enter. These therefore are swing entries.
It is important to understand that most swing setups do not lead to swing trades. As soon as traders are disappointed, many exit. Those who exit prefer to get out with a small profit (scalp), but often have to exit with a small loss.
If the risk is too big for your account, you should wait for trades with less risk or trade an alternative market like the Micro E-mini.
Summary of today’s S&P E-mini price action
Jed created the SP500 E-mini chart.
E-mini end of day video review
Periodic end of day review videos will be moved to top of page when done.
See the weekly update for a discussion of the price action on the weekly chart and for what to expect going into next week.
Trading Room
Al Brooks and other presenters talk about the detailed E-mini price action real-time each day in the Brooks Trading Course trading room. We offer a 2 day free trial.
Charts use Pacific Time
When times are mentioned, it is USA Pacific Time. The E-mini day session charts begin at 6:30 am PT and end at 1:15 pm PT which is 15 minutes after the NYSE closes. You can read background information on the market reports on the Market Update page.


