Trading Update: Thursday November 14, 2024 S&P Emini market analysis Emini daily chart Emini 5-minute chart and what to expect today Yesterday’s Emini setups Al created the SP500 Emini charts. Here are reasonable stop entry setups from yesterday. I show each buy entry bar with a green arrow and each sell entry bar with a […]
Emini Bears Want Final Flag
Trading Update: Monday October 14, 2024 End of day video review S&P Emini market analysis Emini daily chart Emini 5-minute chart and what to expect today Friday’s Emini setups Al created the SP500 Emini charts. Here are reasonable stop entry setups from Friday. I show each buy entry bar with a green arrow and each […]
Emini Possible Final Flag
Trading Update: Wednesday May 22, 2024 End of day video review S&P Emini pre-open market analysis Emini daily chart Emini 5-minute chart and what to expect today Yesterday’s Emini setups Al created the SP500 Emini charts. Here are reasonable stop entry setups from yesterday. I show each buy entry bar with a green arrow and […]
Emini Bears Want Final Flag
Trading Update: Tuesday January 30, 2024 S&P Emini pre-open market analysis Emini daily chart Emini 5-minute chart and what to expect today Yesterday’s Emini setups Al created the SP500 Emini charts. Here are reasonable stop entry setups from yesterday. I show each buy entry bar with a green arrow and each sell entry bar with […]
Crude Oil Failed Breakout
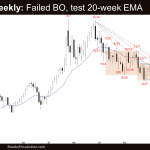
Market Overview: Crude Oil Futures The Crude oil futures looks like a Crude Oil failed breakout after trading far below the triangle and 16-week trading range but reversed higher into the trading range. The bears hope that the market will continue to trade sideways to down in April. The 4 consecutive doji(s) with prominent tails […]
DAX 40 Tight Trading Range and Possible Final Flag
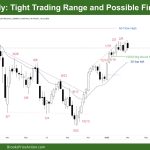
Market Overview: DAX 40 Futures DAX futures moved lower last week with a bear bar in the middle of the prior week’s strong bull bar. Its alternating bars, a Dax 40 tight trading range and a place of agreement for traders. This will form a magnet when we move away from here. The bulls see […]
Bitcoin Bull Reversal from Final Flag
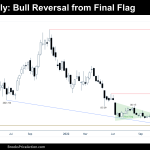
Market Overview: Bitcoin Futures Bitcoin futures are reversing up from a final flag pattern, a Bitcoin bull reversal. During the week, the price increased +14.53% of its value. The current rally is the biggest one since 2021. Bitcoin futures The Weekly chart of Bitcoin futures Analysis Trading The Daily chart of Bitcoin futures Analysis Trading […]
Nifty 50 Futures Breakout Gap
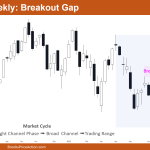
Market Overview: Nifty 50 Futures Nifty 50 futures breakout gap on the weekly chart confirmed by forming consecutive bull bars near the top of the developing trading range, which is more likely to get converted to an exhaustion gap. On the daily chart, the market formed a triangle late in the trend, and also there […]
Nifty 50 futures trading range likely
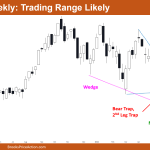
Market Overview: Nifty 50 Futures Nifty 50 futures on weekly chart gave strong bull close after wedge bottom and 2nd leg trap increasing chances of upside momentum for next week. But trading range likely due to sharp selloff in previous week. Nifty 50 on daily chart turned out that bear flag was final flag, so there […]
Nifty 50 strong bull close
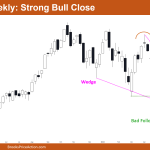
Market Overview: Nifty 50 Futures Nifty 50 strong bull close on futures weekly chart, near wedge bottom line, and possible failed bear breakout of a cup & handle pattern. On the daily chart, Nifty 50 forming possible final flag, so the least bulls can expect is a trading range on both weekly and daily charts. Nifty […]

