Market Overview: Nifty 50 Futures
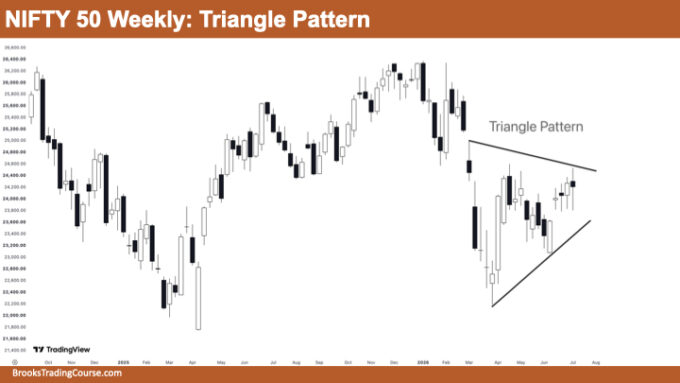
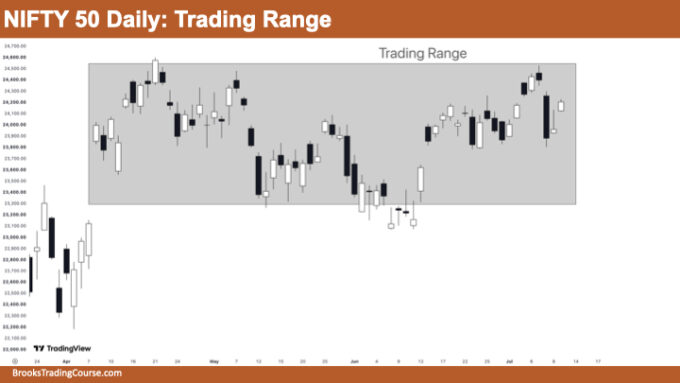
Nifty 50 Triangle Pattern and Trading Range. On the weekly chart, the market had a strong bull trend into the highs, followed by a sharp selloff, and it has since contracted into a triangle formed by a down-sloping upper trend line and an up-sloping lower trend line. This triangle is a form of trading range, so traders can expect quick reversals and failed breakouts, and chances are that buying low and selling high is better than trading breakouts until there is strong follow-through. Traders may wait for the market to reach either end of the triangle before deciding on a new position. On the daily chart, Nifty 50 is trading inside a well-defined trading range and has recently rallied from the bottom of the range back up toward the top. Because the market has repeatedly reversed at both ends and strong bars have lacked follow-through, this suggests that the market is still two-sided, and traders may look to sell a reversal near the top of the range rather than assume a breakout.
Nifty 50 futures
The Weekly Nifty 50 chart
- General Discussion
- Traders who are holding a long position may continue to hold, but they should be aware that the market is now inside a triangle, which is a form of trading range. They may move their stop to below the lower trend line of the triangle, which would be a wide stop appropriate for a weekly chart. Because the market is contracting, longs may also consider taking partial profits near the upper trend line, since the triangle can lead to failed breakouts in either direction.
- Traders who are holding a short position from the selloff have already seen a strong move in their favor, but the market has since formed a triangle and stopped falling. They may tighten their stop to above the upper trend line of the triangle. If the market forms consecutive bull bars closing near their highs, short traders may consider exiting, since the sharp selloff has been followed by a sideways contraction rather than continued selling.
- Traders who are not holding any position may wait for the market to reach either the upper or the lower trend line of the triangle before deciding. They may buy near the lower trend line with a stop below it, or sell near the upper trend line with a stop above it. Chances are that trading is a better strategy than breakout mode while the triangle remains intact.
- Deeper into price action
- The market had a strong bull trend into the highs, followed by a sharp selloff with large bear bars. Because the selloff was so strong, the bears expected lower prices, but instead the market began to contract into a triangle. This is a sign that the bears were not able to maintain their momentum, and the strong bear trend has transitioned into a trading range.
- The bars inside the triangle are overlapping with more prominent tails and less follow-through than the bars during the earlier trend. This overlap is a sign of a two-sided market, where both the bulls and the bears are active but neither is in control. Traders should expect quick reversals and be cautious about trusting any single strong bar as the start of a new trend.
- The triangle is narrowing as it moves toward its apex, which means the market is becoming more balanced. As the range tightens, traders may expect a breakout at some point, but the first breakout attempt out of a triangle often fails and reverses back inside. Traders should wait for follow-through before assuming a breakout is real.
- Patterns
- The main pattern is a triangle formed by a down-sloping upper trend line and an up-sloping lower trend line. This is a contracting trading range, and traders may buy low, sell high, and scalp until there is a clear breakout with strong follow-through.
- Because the triangle followed a strong selloff, it can act as either a continuation pattern leading to another leg down, or a bottom leading to a resumption of the earlier bull trend. Traders may keep an open mind and let the breakout direction, along with its follow-through, tell them which side is stronger.
The Daily Nifty 50 chart
- General Discussion
- Traders who are holding a long position from near the bottom of the range have a good profit, but the market is now near the top of the trading range. They may move their stop up and consider taking partial profits, since the market can reverse down from resistance. Holding a full long position at the top of a trading range is a lower-probability trade, because the market has repeatedly reversed at both ends.
- Traders who are holding a short position have been trading against a market that is currently rallying toward the top of the range. They should use a stop above the top of the trading range. If the market breaks out above the range with strong bull bars closing near their highs, short traders may exit, but chances are the market will reverse back down from the resistance since it is still a trading range.
- Traders who are not holding any position may wait for the market to reach the top of the range and look to sell a reversal, or wait for a pullback back down to the bottom of the range to buy. Selling near the top with a stop above the range, and buying near the bottom with a stop below it, is the higher-probability approach while the trading range is intact.
- Deeper into price action
- The market has repeatedly reversed at both the top and the bottom of the range, which is the defining behavior of a trading range. When it reached the bottom near early June, it reversed up, and as it now approaches the top, traders should expect selling pressure to appear. These repeated reversals are a sign that neither the bulls nor the bears can sustain a trend on the daily chart.
- Many of the bars inside the range are overlapping with tails on both ends, and strong bars are often followed by reversals rather than follow-through. This lack of follow-through is a sign of a trading range, and traders should not trust breakouts until there is strong follow-through. Bars that surprise in one direction are frequently reversed within a few bars.
- The current rally to the top of the range is a bull leg within the range, not necessarily the start of a new bull trend. Traders should watch how the market behaves at the top, because a strong reversal bar there would favor another leg down, while strong bull bars breaking out with follow-through would be needed to signal a real breakout.
- Patterns
- The main pattern is a horizontal trading range, and traders may trade it by buying low and selling high until there is a clear breakout. Because the market is near the top of the range, the odds favor a reversal down rather than a sustained breakout.
- The move up from the early June low to the current highs can be seen as a bull leg inside the range, and it may form a lower high or a double top with the earlier highs near the top of the range. Traders may watch for a reversal setup at the top before committing to a short.
Market analysis reports archive
You can access all weekend reports on the Market Analysis page.


