Trading Update: Wednesday July 8, 2026
S&P E-mini market analysis
E-mini daily chart
- The daily chart of the E-mini continues to form a triangle, with 7,500 being the midpoint of the contracting range.
- The bulls formed a two-legged rally up to the July 6th high, and the market reversed down on July 7th.
- The bears are hopeful that July 7th is forming a lower high and that they will get a downside breakout, because the range has been contracting ever since the start of June.
- This increases the risk that the market is in breakout mode at the moment.
- The odds are that there are probably buyers below the July 6th low, and the bulls will get a rally up to the June 15th high and ultimately the all-time high at 7,700.
- The bears are hopeful that they will be able to remain in control and create a strong entry bar closing on its low for today.
- At the moment, it looks like today is going to be a disappointment bar for the bears, which increases the chances of more sideways trading.
- The 7,500 level is around the midpoint of the triangle, and it is therefore likely to be an important round number for the next several months because of the rally in June.
- With the higher time frames being fairly strong and climactic, the odds increase that the market is going to go sideways for several months.
- On the daily chart overall, traders should expect continued trading-range price action, with the odds slightly favoring a test of the all-time high over the next several weeks.
E-mini 5-minute chart and what to expect today
- The E-mini gapped down on the open and rallied for the first three bars, forming a triangle as the market went sideways for the first 12 bars of the day.
- Because of the gap down and the market forming a triangle below the moving average, the odds increased that the bears were going to get a downside breakout.
- The Globex chart had a strong sell-off prior to and during the overnight session.
- This increased the risk that the bears were going to get a second leg down and a test of the Globex low, which was around 7,470.
- The bears got a parabolic wedge bottom down to bar 24, along with a strong enough reversal bar closing on its high, so the odds favored buyers buying a second leg up.
- This was supported by the trading-range price action during the first 12 bars of the day and the disappointing follow-through on the way down to bar 25.
- That increased the risk that the sell-off to the bar 25 low was just a bear leg in what would become a trading range.
- This is what led to the strong rally from the bar 25 low all the way up to the bar 42 high.
- The bulls got a strong reversal up on bars 31, 32, and 33, which increased the odds of a second leg up, buyers below, and a test back to the opening of the day at bar 42.
- The rally is strong enough that the market is likely to find buyers below and continue to trade sideways to up, or at least sideways, for the next several bars.
- This means the downside is likely limited.
Yesterday’s E-mini setups
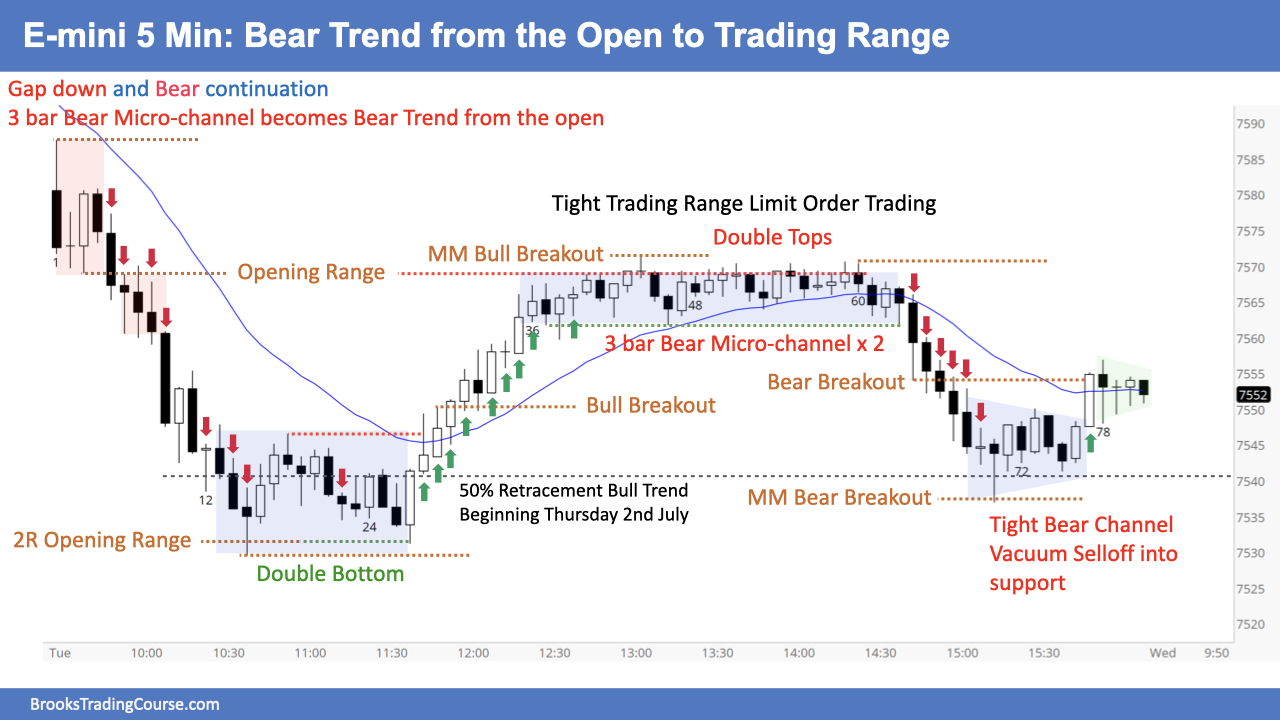
Jed created the SP500 E-mini chart.
Here are reasonable stop entry setups from yesterday. Chart shows each buy entry bar with a green arrow and each sell entry bar with a red arrow. Buyers of the Brooks Trading Course have access to a near 4-year library of detailed explanations of swing trade setups (see Online Course/BTC Daily Setups) linked to the Brooks Encyclopedia of Chart Patterns product.
The goal with these charts is to present an Always In perspective. If a trader was trying to be Always In or nearly Always In a position all day, and he was not currently in the market, these entries would be logical times for him to enter. These therefore are swing entries.
It is important to understand that most swing setups do not lead to swing trades. As soon as traders are disappointed, many exit. Those who exit prefer to get out with a small profit (scalp), but often have to exit with a small loss.
If the risk is too big for your account, you should wait for trades with less risk or trade an alternative market like the Micro E-mini.
Summary of today’s S&P E-mini price action
Jed created the SP500 E-mini chart.
E-mini end of day video review
Periodic end of day review videos will be moved to top of page when done.
See the weekly update for a discussion of the price action on the weekly chart and for what to expect going into next week.
Trading Room
Al Brooks and other presenters talk about the detailed E-mini price action real-time each day in the Brooks Trading Course trading room. We offer a 2 day free trial.
Charts use Pacific Time
When times are mentioned, it is USA Pacific Time. The E-mini day session charts begin at 6:30 am PT and end at 1:15 pm PT which is 15 minutes after the NYSE closes. You can read background information on the market reports on the Market Update page.


