Market Overview: Crude Oil Futures
Crude oil bears want a large second leg sideways to down. Bears want the 20-week EMA or the bear trend line to act as resistance. Bulls need consecutive bull bars closing near their highs to demonstrate control.
Crude oil futures
The Weekly crude oil chart
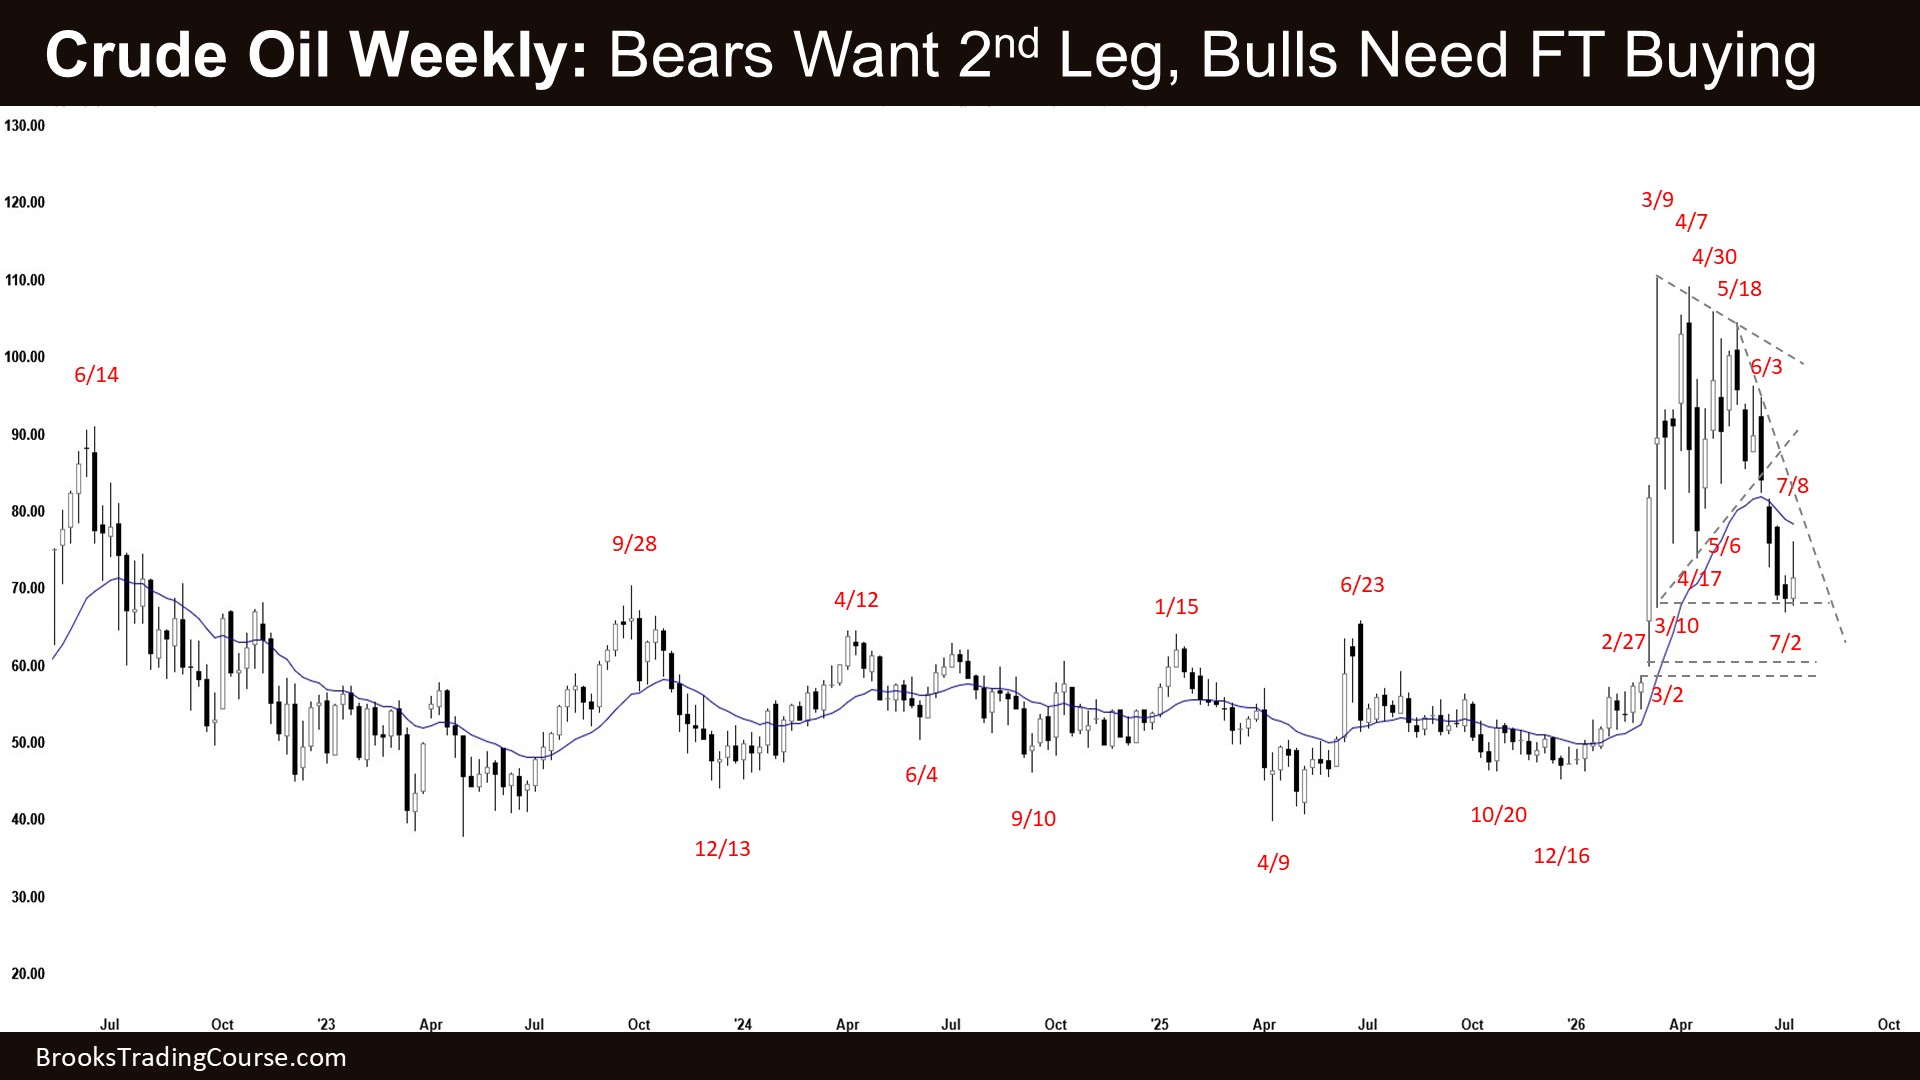
- This week formed a bull bar, closing in its lower half with a long upper tail.
- Last week, we said traders would watch whether bears could generate additional follow-through bear bars breaking decisively below the March 10 low or whether the market would stall around the March 10 or March 2 low area, followed by a pullback to test the 20-week EMA instead.
- Bulls see the recent move (July 2) as a sell vacuum bear leg testing the low of the 18-week trading range (March 10).
- Bulls want the low of the trading range to act as support.
- If the market trades lower, bulls want the March 2 low or the February 27 breakout point to provide support.
- Bulls need consecutive bull bars closing near their highs to demonstrate control.
- Bears generated a strong bear leg, testing the low of the 18-week trading range (March 10).
- The move down is in a tight bear channel, indicating persistent selling.
- Bears see this week as a pullback and want it to remain weak, with overlapping candlesticks and prominent upper tails, forming a lower high followed by a larger second leg sideways to down.
- Bears want the 20-week EMA or the bear trend line to act as resistance.
- The next targets for the bears are the March 2 low and the February 27 breakout point of the rally.
- Bears need additional strong bear bars to increase the odds of a sustained move lower.
- The move down from the May 18 high is in a tight bear channel, indicating strong bears.
- The market is likely Always In Short.
- Traders will watch whether bears can generate a larger second leg sideways to down, breaking decisively below the March 10 low — or whether the market stalls around the March 10 or March 2 low, followed by a pullback to test the middle of the trading range in the weeks ahead.
The Daily crude oil chart
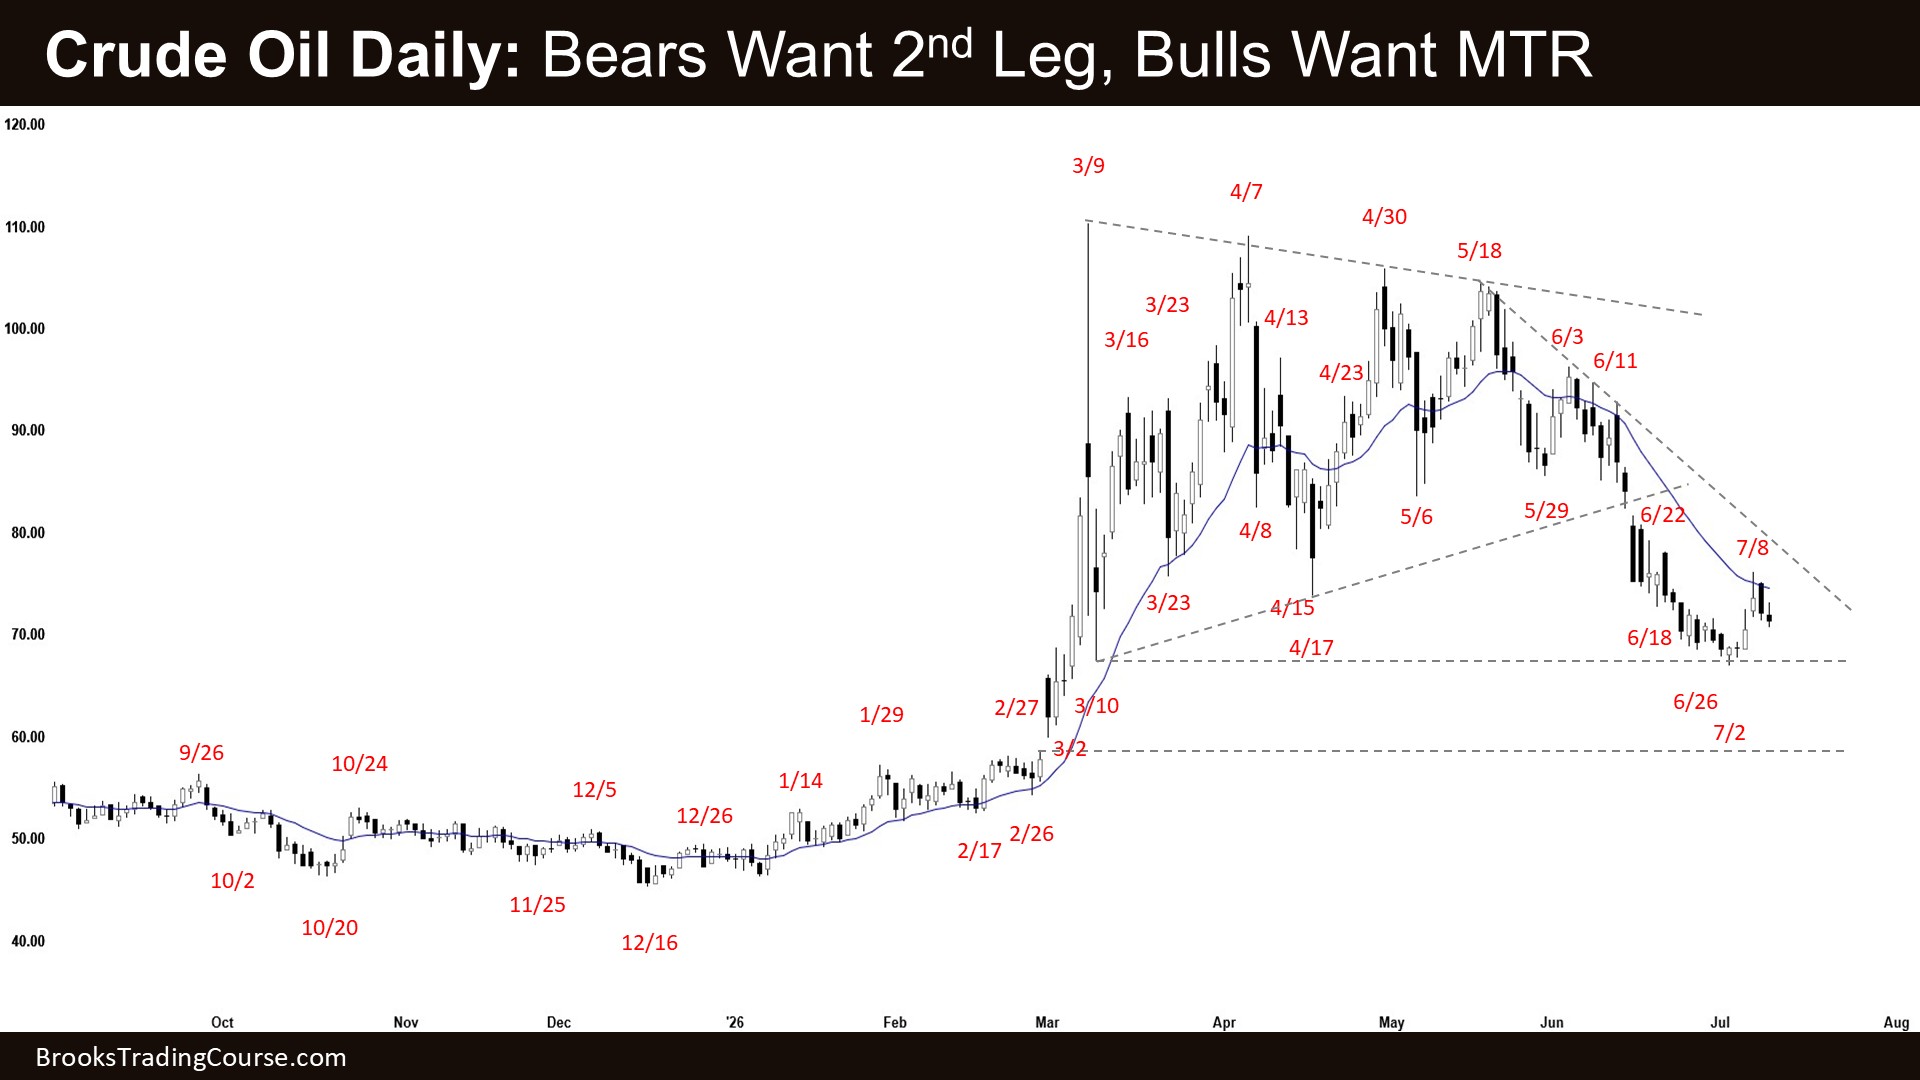
- The market formed a bear leg testing the March 10 low, followed by a pullback to test the 20-day EMA this week.
- Previously, we said traders would watch whether bears could generate additional follow-through selling to test the June 23 breakout point. If a pullback developed, traders would watch whether the 20-day EMA or the bear trend line acted as resistance.
- Bulls see the recent move (July 2) as a sell vacuum bear leg testing the low of the trading range (March 10).
- Bulls hope the March 10 low or the February 27 high breakout point will act as support.
- Bulls hope to get a pullback to test the middle of the trading range.
- Bulls need consecutive bull bars closing near their highs and breaking far above the 20-day EMA to demonstrate control.
- Bears created a strong bear leg testing the low of the trading range (March 10).
- Bears see the current move as a breakout pullback test of the April 17 breakout point and want a larger second leg sideways to down.
- Bears want the pullback to remain weak, with overlapping bars and prominent upper tails.
- Bears want the 20-day EMA or the bear trend line to act as resistance, forming another lower high and a double top bear flag with the June 22 high.
- The next targets for the bears are the March 2 low and the February 27 breakout point.
- Bears need sustained follow-through selling to increase the odds of a larger second leg sideways to down.
- Crude oil formed a tight bear channel testing the March 10 low, followed by a pullback testing the 20-day EMA.
- Traders will watch whether bears can generate a strong retest of the July 2 low, followed by a larger second leg sideways to down — or whether the market forms a second leg sideways to up to test the June 22 high instead.
Market analysis reports archive
You can access all weekend reports on the Market Analysis page.


