Market Overview: Nifty 50 Futures
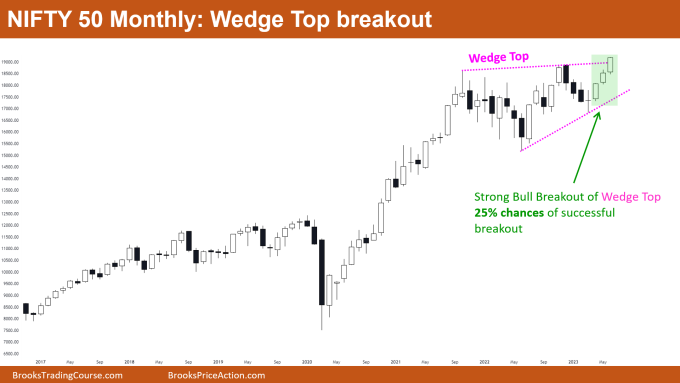
Nifty 50 Wedge Top Breakout on the monthly chart. On the monthly chart, the market formed its third consecutive bull bar as it closed close to its high. This month, the market also provided a strong close above the wedge top (breakout). In general, there is a 25% chance of a bullish breakout of a wedge top late in a trend and a 75% chance of a bearish breakout. The bull bar is very large in comparison to the previous 20 bars, and this could result in a potential buy climax rather than a successful breakout in the market on the weekly chart.
Nifty 50 futures
The Monthly Nifty 50 chart

- General Discussion
- The Nifty 50 is in a strong bull trend on the monthly chart, and the market made a strong close above the wedge top, so bears shouldn’t be selling right now.
- Because placing stop orders at the high of a bull bar would result in a huge stop-loss, bulls can enter with limit orders (placing at the low of bars).
- Because there are currently slim chances for a bull breakout to be successful, bulls should continue to maintain a favourable risk-to-reward ratio.
- Deeper into the price action
- In general, an overshoot of a bull channel or wedge top is regarded as a bull breakout, and there is less chance that an overshoot will result in a successful breakout.
- 75% of the time, the market will revert back within 5 bars if the bull breakout of the wedge top fails.
- So, should you buy if you’re a bull?
- As was already mentioned, limit orders can be used to enter the market. In other words, you can enter the market by placing buy limit orders at the low of the most recent bull bar.
- However, in order to have a positive traders equation, you should maintain a good risk to reward ratio (3R, 4R), as the likelihood of success is lower (25%).
- Bulls being able to provide a strong follow-through bar would increase the likelihood of a successful breakout.
- So, you should wait for a strong follow-through bar to buy if you want a trade with a fair amount of probability.
- Patterns
- Wedge Top overshoot on the monthly chart.
- Traders should closely monitor the upcoming bar; if the bulls are successful in getting a strong follow-through bar, the market may continue its bull trend; otherwise, it may turn into a big trading range.
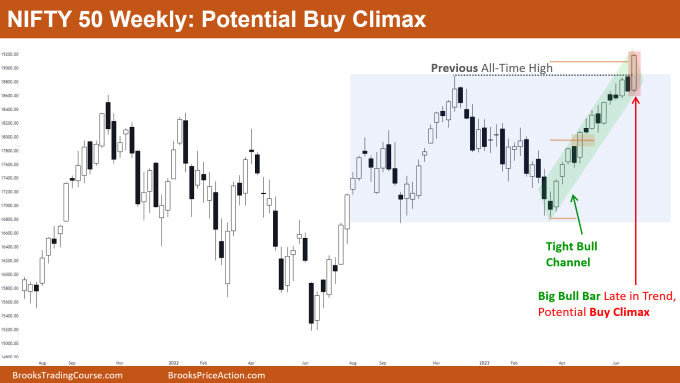
The Weekly Nifty 50 chart

- General Discussion
- Late in the trend, the market formed a surprise bar that may signal the beginning of a buy climax.
- Since the market is still in a strong bull trend and is trading inside the tight bull channel, bears shouldn’t sell.
- Bears may sell once the market forms a sequence of consecutive bear bars or if there are no follow-through bars after the surprise bar.
- Since the market formed a large bull bar, which results in a large stop-loss, and because the market is currently trading close to the top of the tight bull channel, bulls shouldn’t be buying at these levels.
- Deeper into price action
- Some bulls may sell their long positions after the market this week reached the measuring gap measured move target (represented by the brown line).
- Bulls need a strong follow-through bar for this bull breakout to be successful.
- If bulls are unable to get a follow-through bar, they may lose confidence and sell their long positions, which will prompt bears to enter the market and sell.
- Patterns
- The market will revert back into the potential trading range (indicated in blue colour) if bulls are unable to get a follow-through bar.
- The big round number 19000 will act like a magnet for the price.
- Bulls can look to buy on high-2 entries if they are successful in getting a follow-through bar.
- If bulls can obtain a follow-through bar after the market forms a bull surprise bar, the likelihood of a 2nd leg up increases.
Market analysis reports archive
You can access all weekend reports on the Market Analysis page.

