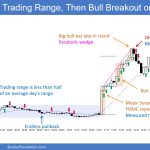
Trading Update: Thursday December 14, 2023 S&P Emini pre-open market analysis Emini daily chart Emini 5-minute chart and what to expect today Emini intraday market update Yesterday’s Emini setups Al created the SP500 Emini charts. Here are reasonable stop entry setups from yesterday. I show each buy entry bar with a green arrow and each […]
Emini Daily Chart Becoming Climactic
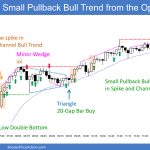
Trading Update: Friday November 3, 2023 S&P Emini pre-open market analysis Emini daily chart Emini 5-minute chart and what to expect today Yesterday’s Emini setups Al created the SP500 Emini charts. Here are reasonable stop entry setups from yesterday. I show each buy entry bar with a green arrow and each sell entry bar with […]
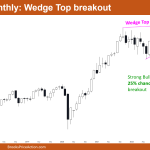
Nifty 50 Wedge Top Breakout
Market Overview: Nifty 50 Futures Nifty 50 Wedge Top Breakout on the monthly chart. On the monthly chart, the market formed its third consecutive bull bar as it closed close to its high. This month, the market also provided a strong close above the wedge top (breakout). In general, there is a 25% chance of […]
Emini Buy Climax Closing Beyond 4,450
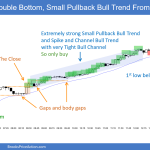
Trading Update: Friday June 16, 2023 S&P Emini pre-open market analysis Emini daily chart Emini 5-minute chart and what to expect today Yesterday’s Emini setups Al created the SP500 Emini charts. Here are several reasonable stop entry setups from yesterday. I show each buy entry with a green rectangle and each sell entry with a […]
Emini May Pullback for a Few Days
Trading Update: Friday April 28, 2023 S&P Emini pre-open market analysis Emini daily chart Emini 5-minute chart and what to expect today Yesterday’s Emini setups Al created the SP500 Emini charts. Here are several reasonable stop entry setups from yesterday. I show each buy entry with a green rectangle and each sell entry with a […]
Nifty 50 Inside Bar Pattern
Market Overview: Nifty 50 Futures Nifty 50 inside bar pattern on the weekly chart and still trading near the bottom of the bull channel. Bulls and bears can expect some sideways price action for the next few bars. Nifty 50 is trading inside a bear channel on the weekly chart and can fall to a […]
Nifty 50 Futures Expanding Triangle
Market Overview: Nifty 50 Futures Nifty 50 futures expanding triangle on the weekly chart, the market formed a bear bar after 4 weeks. Bulls expect one more leg up before any reversal, but bulls can book some profits as an expanding triangle top. Nifty 50 on daily chart forming minor wedge top which has a […]
Emini weak pullback from parabolic wedge buy climax
Market Overview: Weekend Market Analysis SP500 Emini weak pullback phase on daily chart following a parabolic wedge buy climax at a trend channel line. Pullback from a parabolic wedge buy climax typically has at least a small 2nd sideways to down leg. The bulls want a test of the trend extreme. The EURUSD Forex is […]
Emini in July extreme buy climax but 1st reversal will be minor
Market Overview: Weekend Market Analysis The SP500 Emini futures is breaking strongly above a 3-month bull channel in an extreme buy climax. The magnets above are the top of the bull channel and measured move targets. Since there have been 11 days without a pullback, there should be a brief pullback next week. The EURUSD […]
Emini futures might gap up to new high on weekly chart, but daily chart bull streak is buy climax
Market Overview: Weekend Market Analysis The S&P500 Emini futures market might gap to a new all-time high on the weekly chart next week. But the streak of 9 consecutive bull bars on the daily chart that ended 2 weeks ago should lead to a pullback to 3200 starting within a couple weeks. Bond futures are […]
