Trading Update: Friday August 19, 2022
Emini pre-open market analysis
Emini daily chart
- The open of the week (4,258.25) will be important today. The bulls have four consecutive bull bars on the weekly chart, and the bears want close below week open, and will try their best to end the bull streak.
- Traders should pay attention to the open of the week as it will likely be important as the market decides to close above or below it.
- The Emini is beginning to go sideways on the daily chart.
- The bull rally since the July 14 low is exhaustive and likely to have a correction.
- While this rally is a small pullback bull trend, it has had consecutive buy climaxes and is within an overall trading range.
- The market is also hesitating under resistance levels, top of the bear trendline (January and March 29 lower high), April 18 low. Another resistance level is the July 14 low to the measuring gap (July 22 and August 2nd), projecting up to the April 18 low.
- The market will likely test the midpoint of the year’s range (4,222 area). The reason for this is that there were bears who sold this price level, betting it was resistance, and they could at least make a scalp; they likely scaled in higher and will take profits back at the 4,222 price level.
- Overall, the market will likely begin to go sideways to down. Since the market is in a trading range, the pullback from the August rally could be deeper than bulls want and test the 4,000 big round number.
- At the moment, the downside is likely limited due to the lack of selling pressure.
Emini 5-minute chart and what to expect today
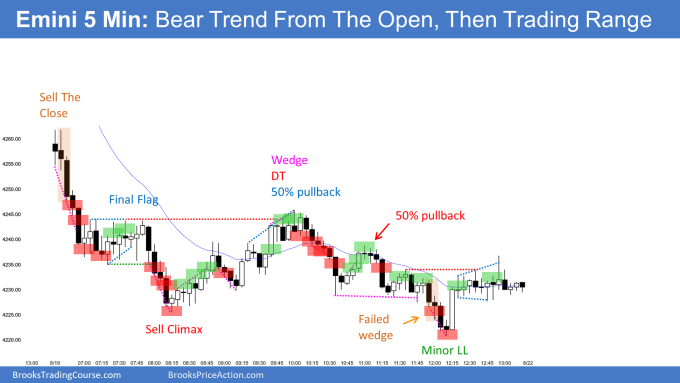
- Emini is down 35 points in the overnight Globex session.
- The market will gap down on the open.
- Traders should pay attention to the open of the week (4,258.25) as it will likely be an important magnet today. The bears want to end the weekly chart four consecutive bull bars streak.
- As always, traders should assume that the day will be a trading range open and have lots of sideways trading.
- As I often say, most traders should be patient on the open and consider waiting for 6-12 bars before placing a trade. Most opens have multiple reversals and go sideways, so there usually is not a rush to enter the market.
- Traders can also wait for a strong breakout with follow-through breaking out of the initial range.
- Since most opens from some stop entry setup, traders can wait for a double top/bottom or a wedge top/bottom
- Today is Friday, so the weekly chart becomes important. Traders must be mindful that the market can have a surprise breakout late in the day as institutions decide on closing the weekly chart. It does not happen every week, but surprise breakouts within the final hour or two of the week are common enough to note.
Yesterday’s Emini setups

Al created the SP500 Emini charts.
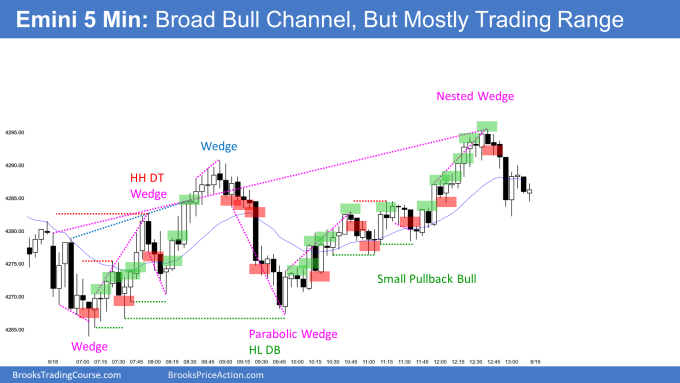
Here are several reasonable stop entry setups from yesterday. I show each buy entry with a green rectangle and each sell entry with a red rectangle. Buyers of both the Brooks Trading Course and Encyclopedia of Chart Patterns have access to a much more detailed explanation of the swing trades for each day (see Online Course/BTC Daily Setups).
My goal with these charts is to present an Always In perspective. If a trader was trying to be Always In or nearly Always In a position all day, and he was not currently in the market, these entries would be logical times for him to enter. These therefore are swing entries.
It is important to understand that most swing setups do not lead to swing trades. As soon as traders are disappointed, many exit. Those who exit prefer to get out with a small profit (scalp), but often have to exit with a small loss.
If the risk is too big for your account, you should wait for trades with less risk or trade an alternative market like the Micro Emini.
EURUSD Forex market trading strategies
EURUSD Forex daily chart

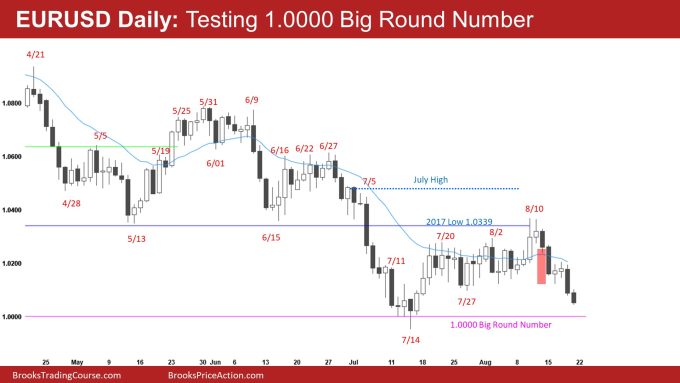
- The EURUSD is getting a 2nd leg down from the August 15 bear breakout and is within 50 pips of the 1.0000 big round number.
- The bulls were happy to buy at this price level and likely will be happy again.
- The bears want a strong breakout below the 1.0000 big round number and below the July 14 lows; however, any bear breakout will likely fail and be bought.
- The bulls do not mind the market testing back down to the 1.0000 big round number because now they can argue they have a more credible bottom.
- The rally up to August 10 was good for the bulls, but it was likely a minor reversal up. The channel down to July 14 was too tight, and the higher low on July 27 was not enough bars for a higher low major trend reversal.
- Now, the bulls have enough bars for a major trend reversal, but they need to stop the selling pressure.
- The bears have three bear bars closing on their close out of the past six bars. And the bulls only have three Doji bars out of the past 6 bars.
- Major trend reversals always have something wrong with them. For the bulls, the problem they have is the selling pressure over the past 6 bars is somewhat stronger than they may want.
- Most bulls would prefer that the market gets closer to the 1.0000 big round number. If today becomes a strong buy signal bar, the bulls will want it to look perfect (close on high, big body, not too big). If the signal bar does not look great, bulls will question if the market has to get closer to the 1.0000 big round number.
- The bears will try their best to make today close near its low, which would slightly increase the odds of another leg down, which would create a wedge.
- Overall, the next few days will be interesting to see what the bulls can do. Most likely, the market will disappoint both bulls and bears.
Summary of today’s S&P Emini futures price action and what to expect tomorrow

Al created the SP500 Emini charts.
End of day video review
See the weekly update for a discussion of the price action on the weekly chart and for what to expect going into next week.
Trading Room
Traders can see the end of the day bar-by-bar price action report by signing up for free at BrooksPriceAction.com. Al talks about the detailed S&P Emini futures price action real-time throughout the day in the BrooksPriceAction.com on trading room days. We offer a 2 day free trial.
Charts use Pacific Time
When times are mentioned, it is USA Pacific Time. The Emini day session charts begin at 6:30 am PT and end at 1:15 pm PT which is 15 minutes after the NYSE closes. You can read background information on the market reports on the Market Update page.
Mr. Wolff:
Your data about Emini open of this week “doesn’t accurate” according to other Brookers (4,277) and platform like Ninja Trader, Yahoo finances, etc. Could you help me with this? Where can i get your data seems more accurate?
“Traders should pay attention to the open of the week (4,258.25) as it will likely be an important magnet today. The bears want to end the weekly chart four consecutive bull bars streak.”
Thanks in advance!!
Open of the week simply is the open of the very first bar of the week market hours, which is exactly 4,258.25.
thanks for the updates.