Market Overview: Bitcoin Futures
Bitcoin futures Bear Breakout attempt of a TTR (Tight Trading Range). During the week, the value of a Bitcoin decreased by 0.97%. Traders wonder if the tight range during the bull channel, it is the beginning of a transition into a trading range. Monday it is the last trading day of the month and the close of the monthly candlestick; so far, July is a small bear bar with a prominent tail on both ends.
Bitcoin futures
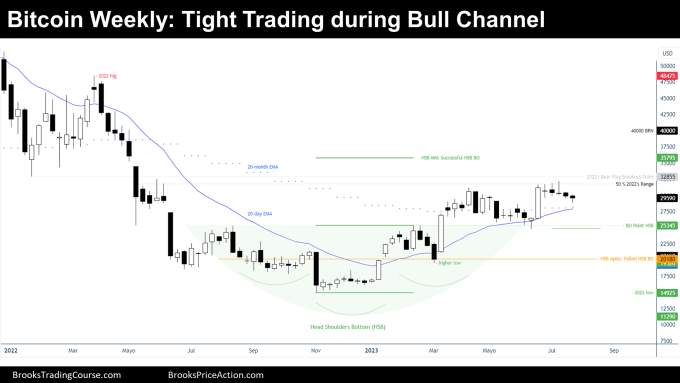
The Weekly chart of Bitcoin futures

Analysis
- This week’s candlestick is a bear doji bar, closing above its midpoint and above last week’s close. The bar traded below the past week’s bear signal bar, and then reversed up. On the daily chart, this was just an attempt of a TTR (Tight Trading Range) breakout.
- The context did not change.
- There is a Bull channel since there was a Bull Breakout of a Head and Shoulders Bottom (HSB) pattern.
- There will probably be a transition into a trading range, where the low will be around $20000, and the high it is yet to be determined.
- Bulls:
- Want a Measured Move (MM) up of the HSB until $35795.
- Ultimately, they want to reverse the whole 2022 bear trend.
- They would rather not see any bar below the Breakout (BO) point of the HSB, but a Double Bottom there.
- Their thesis (MM up to $35795) will be over if the price trades down to the apex of the HSB.
- Bears:
- Want to get to the Apex of the HSB because that will invalidate the HSB Bull Breakout thesis.
- Ultimately, they want to trade below the 2022’s low.
Trading
- Bulls:
- This week’s candlestick, it is not a good bull signal bar.
- They aim to buy a reversal up from the 20-week or 20-month EMA.
- Bears:
- This week’s candlestick, it is not a good sell signal bar.
- They intend to create a micro Double Top with the July high and then sell below a bear bar closing around its low.
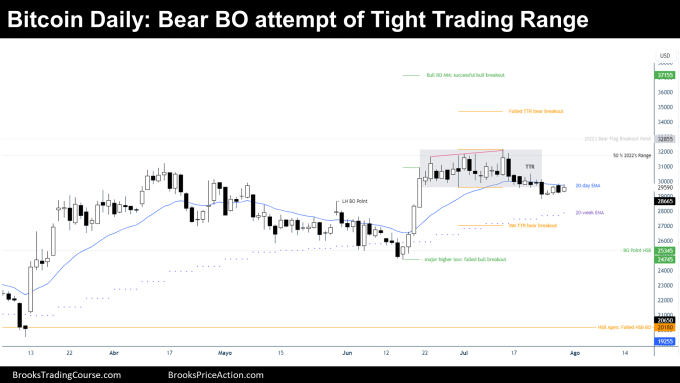
The Daily chart of Bitcoin futures

Analysis
- During the week, there was a bear Breakout attempt of a TTR (Tight Trading Range). The bear breakout was followed by bad follow through, however, the price it is still below the 20-day EMA, trying to create a Micro Double Top Lower High.
- The prior TTR was following a Bull Breakout, and therefore, there might be buyers around the 50% of the bull breakout, which it is also around the 20-week moving average.
- Bulls:
- They want the bears to fail their breakout attempt, and then reverse up at least until the July high.
- They think that the 20-week EMA will act as support before there is a bear trend until the major higher low.
- Moreover, they need to get back to the apex of the TTR quickly, before bears consolidate below the TTR.
- Bears:
- They did not like the follow through after their attempt of a TTR bear breakout, but they think that bears might achieve a lower low, a reversal down from the 20-day EMA.
- Ultimately, they want to get to the major higher low, this is their main bet.
- There are 50% chances that the TTR will provide a bull or a bear breakout. But this pattern attracts traders because normally creates a large move, and the trader’s equation it is positive. 50% chances that risking a little, there will be a good reward.
Trading
- A bear breakout attempt of a TTR provides 2 trade opportunities.
- Bulls:
- They want the bear breakout attempt of a TTR to fail.
- They will buy a buy signal bar, or better, after consecutive bull bars, surging up from the failed attempt of the bear breakout.
- Bears:
- They want the bear breakout attempt of a TTR to succeed.
- They want to sell after a good sell signal bar, or better, after consecutive bear bars, below the TTR low.
Market analysis reports archive
You can access all weekend reports on the Market Analysis page.