Market Overview: Bitcoin Futures
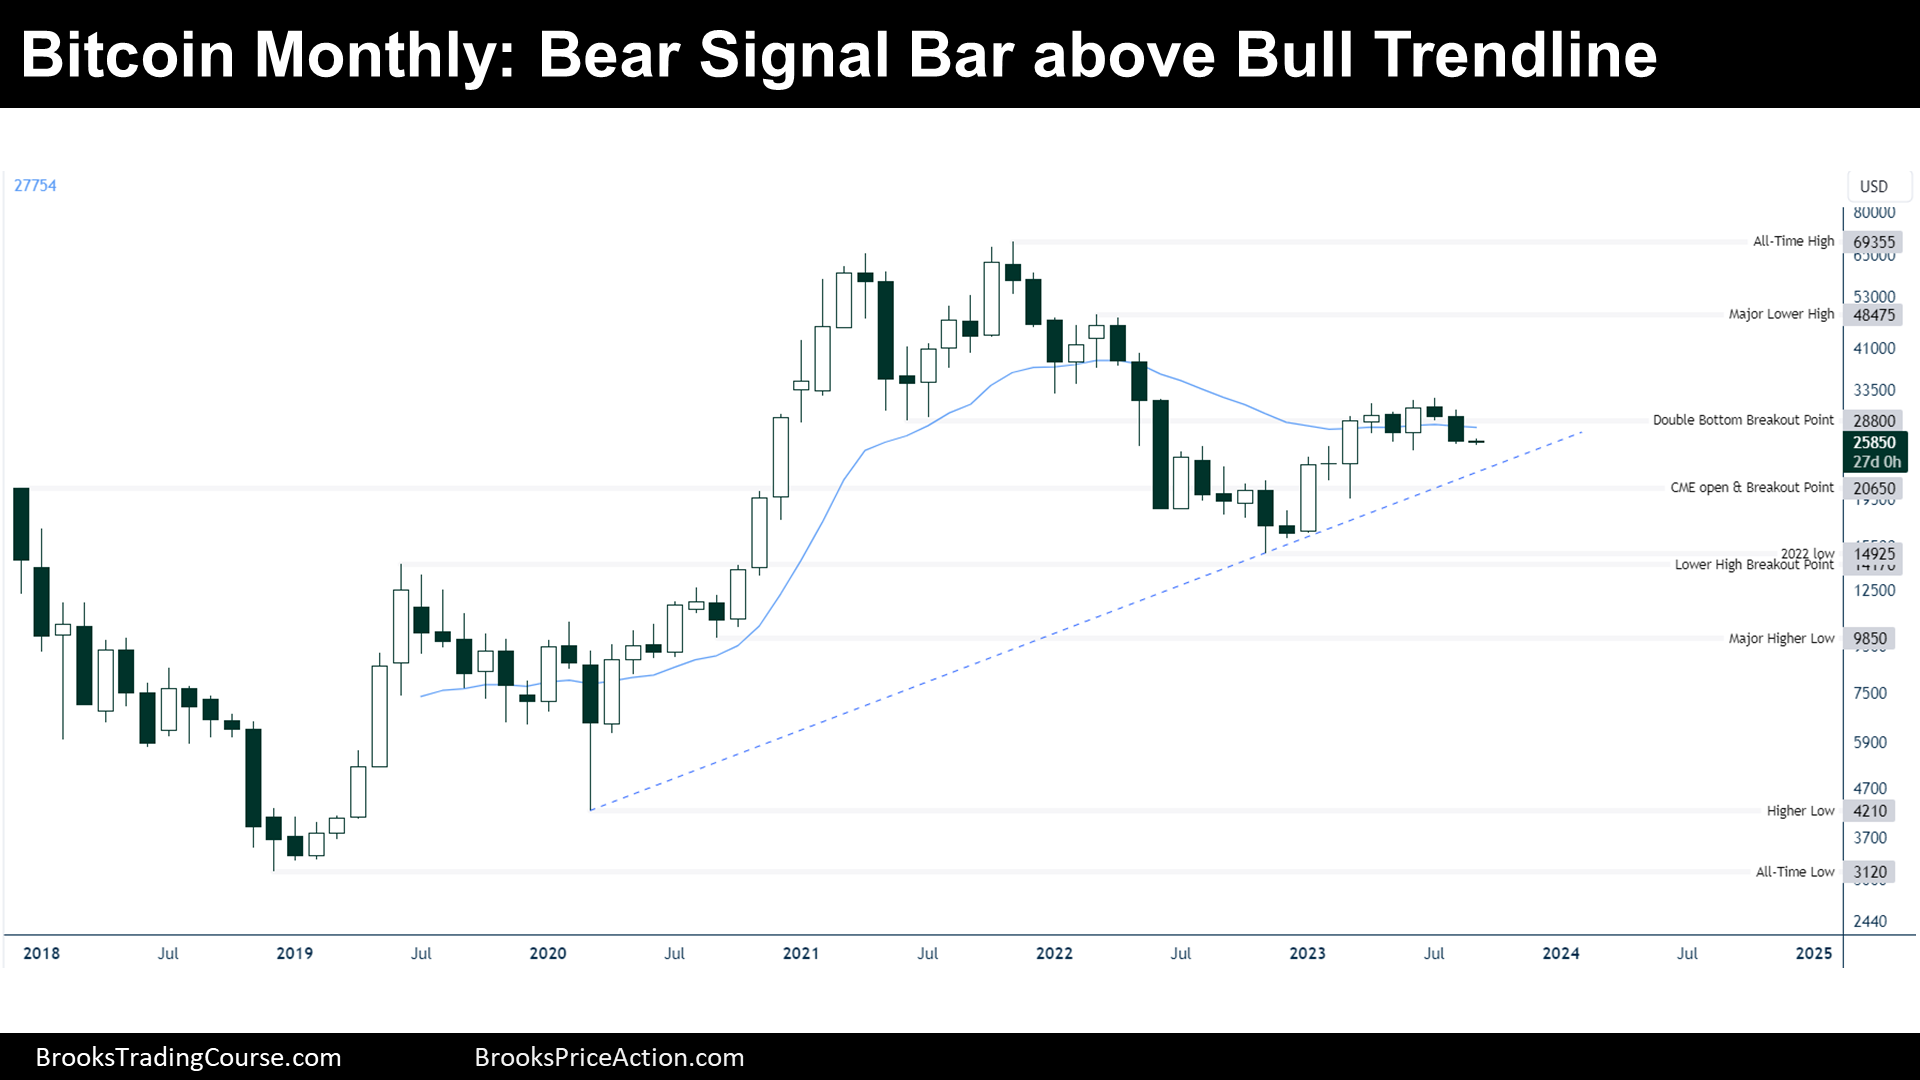
Bitcoin Bear Signal in August. The value of a Bitcoin decreased by 11.25% during August. There is a bear signal bar on the Monthly Chart, bears want to get to the 2022 low and bulls hope to reverse up and start a second leg up after a tight bear channel.
Bitcoin futures
The Monthly logarithmic chart of Bitcoin futures

Past: Supports & Resistances
“Every market probes up and down to discover how far is too far, which then becomes support and resistance. Once traders understand this and how to spot logical support and resistance levels, they are in a position to begin trading.” — Al Brooks.
- Late 2020, Bitcoin did a strong Bull Breakout of prior highs:
- CME Open Breakout Point.
- Lower High Breakout Point.
- Major Higher Low.
- 2020 Low.
- Then, the price went sideways and broke down a small Trading Range, forming:
- All-time high.
- Major Lower High.
- Double Bottom or Trading Range Breakout Point.
- The Bear Breakout found Support at around the CME Open Breakout Point, broke up the trend line of a Bear Channel (or Bull Flag):
- 2022 low.
- After the Bull Breakout of the Bear Channel:
- A Bull Trend line is drawn from the 2020 Low and the 2022 Low.
Present: Market Cycle
- After the powerful 2020s Bull Breakout followed by a strong Bear Channel, traders should expect sideways to up trading.
- A powerful Bull Breakout creates strong support areas that traders buy.
- A strong Bear Channel after a strong Bull Breakout traps bulls into longs.
- Trapped Bulls sell during the next reversal up. The result is Trading Range price action.
Future: Inertia
- A Trading Range tends to trade towards the apex of the Trading Range, here around $42000.
- Moreover, it tends to reverse from prior highs or lows located around the extremes of the Trading Range, which presumably are>
- CME & Lower High Breakout Points.
- Major Lower High.
I expect a 2nd leg up in before there is a Low below 2022’s Low. However, the price might have to test the Bull Trend Line or the CME Open first.
Trading
- Bulls:
- They want to buy around the CME Open or around 2022 Low.
- Furthermore, they will probably buy if there is a reversal up.
- Bears:
- They think that the price it is stalling at the June 2021 Low (Double Bottom Breakout Point) and that this is the start of a swing down towards a new low of the Drawdown.
- There is a Bear Signal Bar in August but since there is the Bull Trend Line and immediate supports right below. I think that it is not a good idea to sell, that it is better to wait to go long since we are, presumably, around the bottom of a future Trading Range.
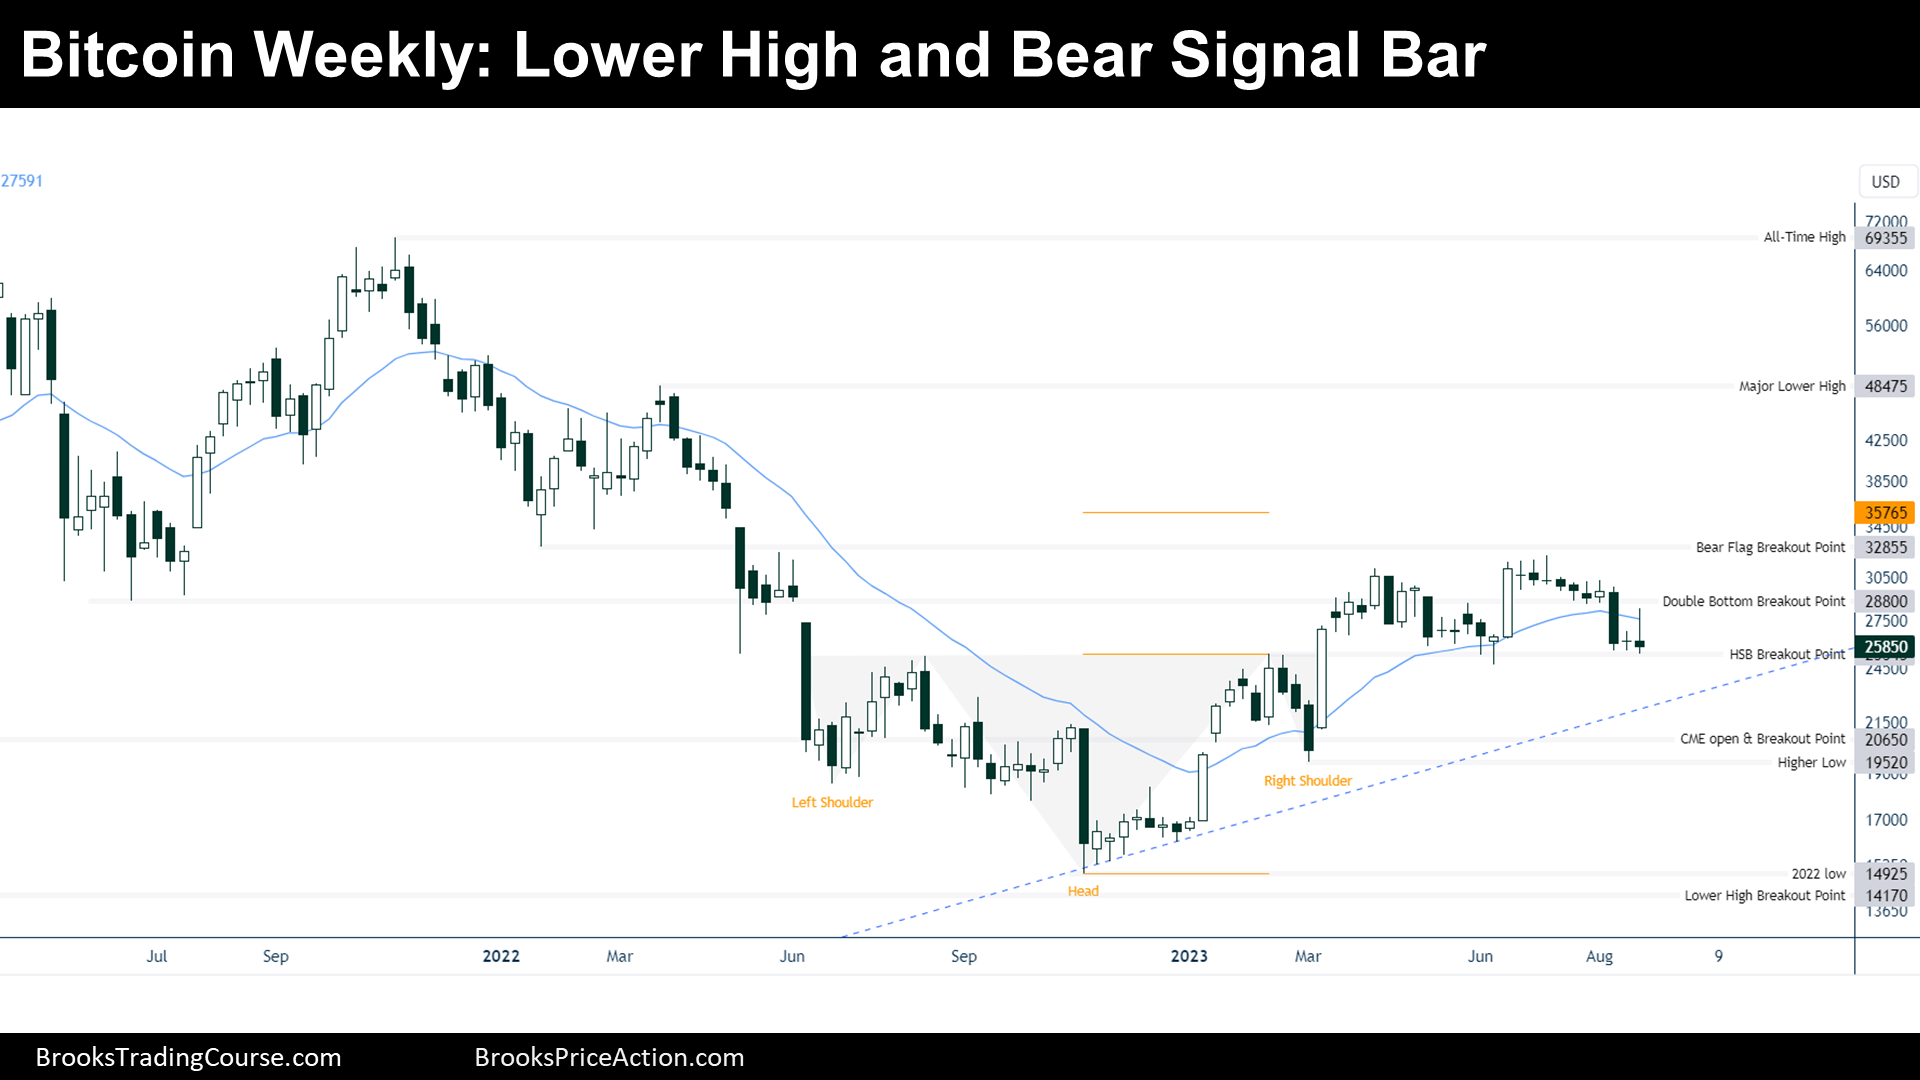
The Weekly logarithmic chart of Bitcoin futures

Past: Supports & Resistances
- A Bear Trend ended after a Head and Shoulders Bottom (HSB) Pattern:
- Major Lower High.
- Lower Low or 2022 Low.
- Major Higher Low.
- Then, the price did a Bull Breakout of the HSB:
- HSB Breakout Point.
Present: Market Cycle
- After the Bull Breakout of the HSB, the price went sideways for more than 20 bars, ending the Bullish momentum. Now, the price is either within a Broad Bull Channel market cycle, or within Trading Range price action.
Future: Inertia
- After a Bull Trend, normally comes a Broad Bull Channel before entering a Trading Range, hence, even if there is a break below the HSB Breakout Point, the price will probably be bought.
Trading
- Bulls:
- They want to buy a reversal up from supports like:
- HSB Breakout Point, Bull Trend Line, CME Open Breakout Point.
- They want to buy a reversal up from supports like:
- Bears:
- They would like to sell below this bear signal bar, they see a bear reversal bar, a possible lower high major trend reversal. Their minimum goal is to get to the Higher Low below. Traders looking for confirmation, will wait for a strong Bear Breakout or a close below the CME Open Breakout Point.
Market analysis reports archive
You can access all weekend reports on the Market Analysis page.