Market Overview: Bitcoin Futures
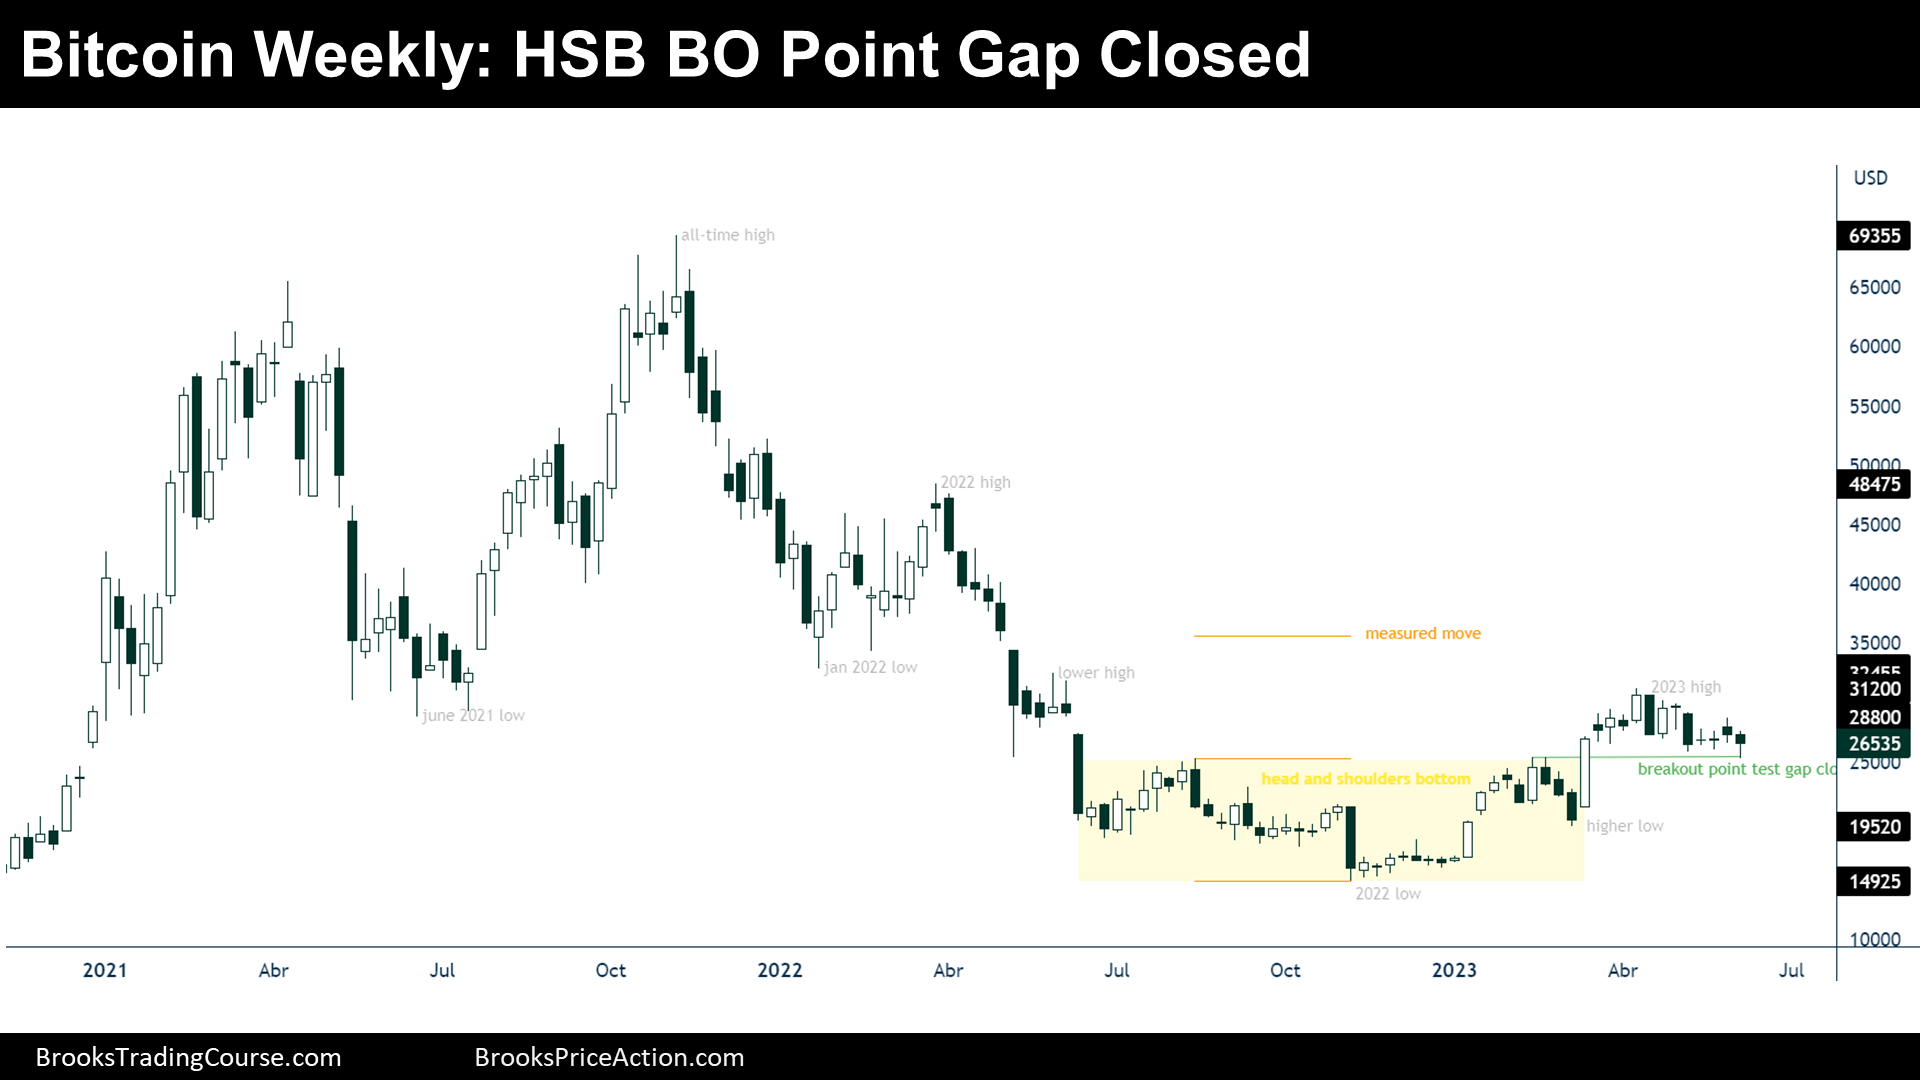
Bitcoin gap closed of prior breakout point. This week, the Bitcoin price decreased 2.87% of its value. Traders wonder if the breakout point will act as support and resume the 2023’s bull trend, or if it will break down the support and test the next higher low.
Bitcoin futures
The Weekly chart of Bitcoin futures

Analysis
- This week’s candlestick is a bear bar closing above its midpoint, with a prominent tail below and a small body.
- The price finally decided to draw a gap closed with the prior breakout point.
- A breakout point formed after a bull breakout of a Head and Shoulders Bottom (HSB) pattern.
- A gap closed means that the bears that sold above the prior higher highs, were able to make money (if they scaled in higher) or, at least, exit breakeven.
- This limits the upside, since bulls will hesitate to sell above higher highs if they know that there will be bears that are going to sell.
- The price is within a Tight Trading Range during the past 12 weeks.
- A TTR is a Breakout Mode Pattern that has a 50% chance of breaking it on either side.
- The loss of momentum (TTR) after the 2023’s bull trend appeared when the price its facing the June 2021 Low resistance. As we anticipated within the 2022 reports, at the June 2021 Low there were, probably, trapped bulls that were meant to create selling pressure.
- Is the June 2021 Low resistance going to lead to a bear breakout of the TTR and a test of the higher low? Or it is going to break on the upside and continue the 2023’s bull trend, at least up to a Measured Move (MM) based upon the HSB range?
- If we zoom out, as we did when analyzed the monthly chart on the last monthly report, we recognize that the price is within a buy zone. However, at the same time, there is a high chance that the first reversal up will fail after a tight bear channel (2022’s tight bear channel).
- When there is confusion, traders should expect trading range price action.
- During trading ranges, the price tends to test prior highs and lows.
- Bulls:
- They want a test of the 2023’s highs, but a gap closed might prevent them to buy above highs.
- A breakout of the TTR and achieve the HSB MM.
- Ultimately, they want to reverse the 2022’s bear trend. For that, they will need a strong breakout with follow through above the TTR.
- Bears:
- They want a test of the higher low.
- The gap closed limits the upside, which might incite them to sell at resistances.
Trading
- Swing Bulls:
- This week’s candlestick is not a good buy signal bar.
- Some bulls might have bought at the HSB breakout point, betting on a small pullback bull trend.
- But the price is below the June 2021 Low resistance, and thus, I think that it is better to wait for a bull breakout of prior highs or, at least, until they see a couple of good consecutive bull candles.
- Swing Bears:
- This week’s candlestick is not a good sell signal bar because there is a prominent tail below. It closed below the past week’s bear bar, but within the tight channel, and hence, it did not generate enough momentum to expect a bearish continuation for the next week.
- Within TTR environments, the best swing strategy is to wait until there is a breakout.
The Daily chart of Bitcoin futures

Analysis
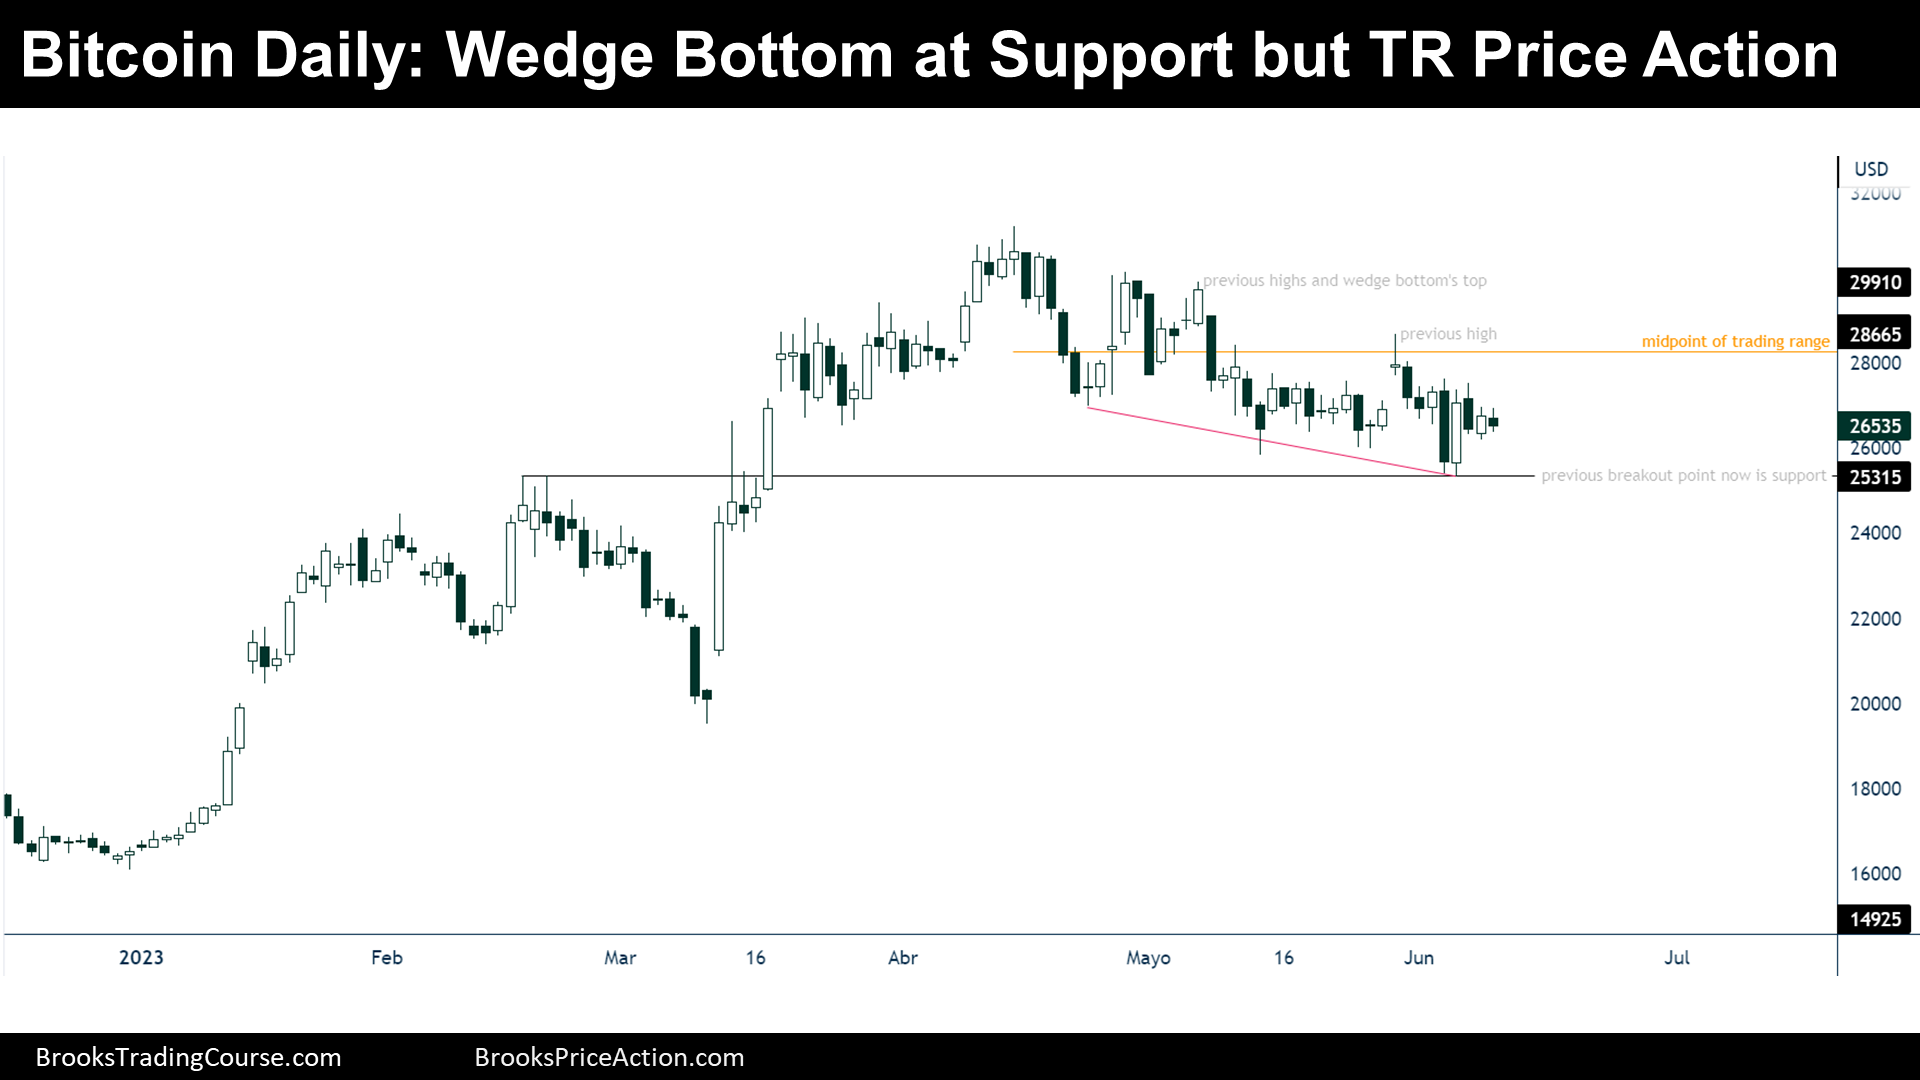
- During the week, the price reached the prior breakout point while a wedge bottom pattern was forming.
- After the gap closed with the breakout point, Bitcoin reversed up strongly, creating a good bull signal bar on Tuesday.
- The follow through, on Wednesday, was bad for the bulls.
- Actually, there are many bars overlapping each other, which means that the trading range price action stills dominates this chart.
- During Trading Range price action, the price tends to test prior highs and lows, and the range’s midpoint.
- This is a limit order trading range, and hence, it is hard to make money trading within it.
- A trading range has a 50% chance of breaking on one side or the other. 80% of breakout attempts fail.
- Before believing that a breakout of the trading range is coming, traders search for a change in the behavior of the price action, this means, they want to start to see consecutive bars with a good body.
- Bulls:
- They aim to see a bull breakout above the prior highs before considering buying.
- Bears:
- They hope to break out the support of the gap closed recently.
- A Trading Range is always followed by a Breakout; thus, traders should expect a breakout to unfold at some point.
Trading
- Until there is a breakout, swing seekers should stay on the sidelines. Once there are traces of a breakout, or a breakout, traders will become active.
Market analysis reports archive
You can access all weekend reports on the Market Analysis page.
Thanks for your analysis, Josep. It is interesting and clear as always. Keep up the good work for all of us!
Hola Elijah!
Thank you for your comment, it boosts my day!
Wishing you a great week ahead,
Josep.